$147.20
Close, 10-06收盤(10-06)
Suggested path: the summary, the four chain lines, the numbers, the catalysts and the playbook. The full argument, the glossary and the per-claim sources are folded; tap one to open it.建議讀法:先看摘要與卡點四行,再看數字、催化劑、操作框架。完整論證、名詞解碼與逐項來源已收合,點開才會展開。
Everpure (formerly Pure Storage) sells flash storage systems for company data centers.
Everpure(前身 Pure Storage)賣企業資料中心用的快閃儲存系統。
Its gross margin fell about two points and the stock dropped 21% for it, but the gross profit it earns still grew 34% a year.
它的毛利率掉了約兩個百分點,股價曾因此跌 21%,但賺到的毛利金額仍年增 34%。
The price of $147.20 is 32.2 times next year's expected profit, so it already pays for the company's strong outlook.
現價 $147.20 是明年預估獲利的 32.2 倍,已經把公司的好展望算進去了。

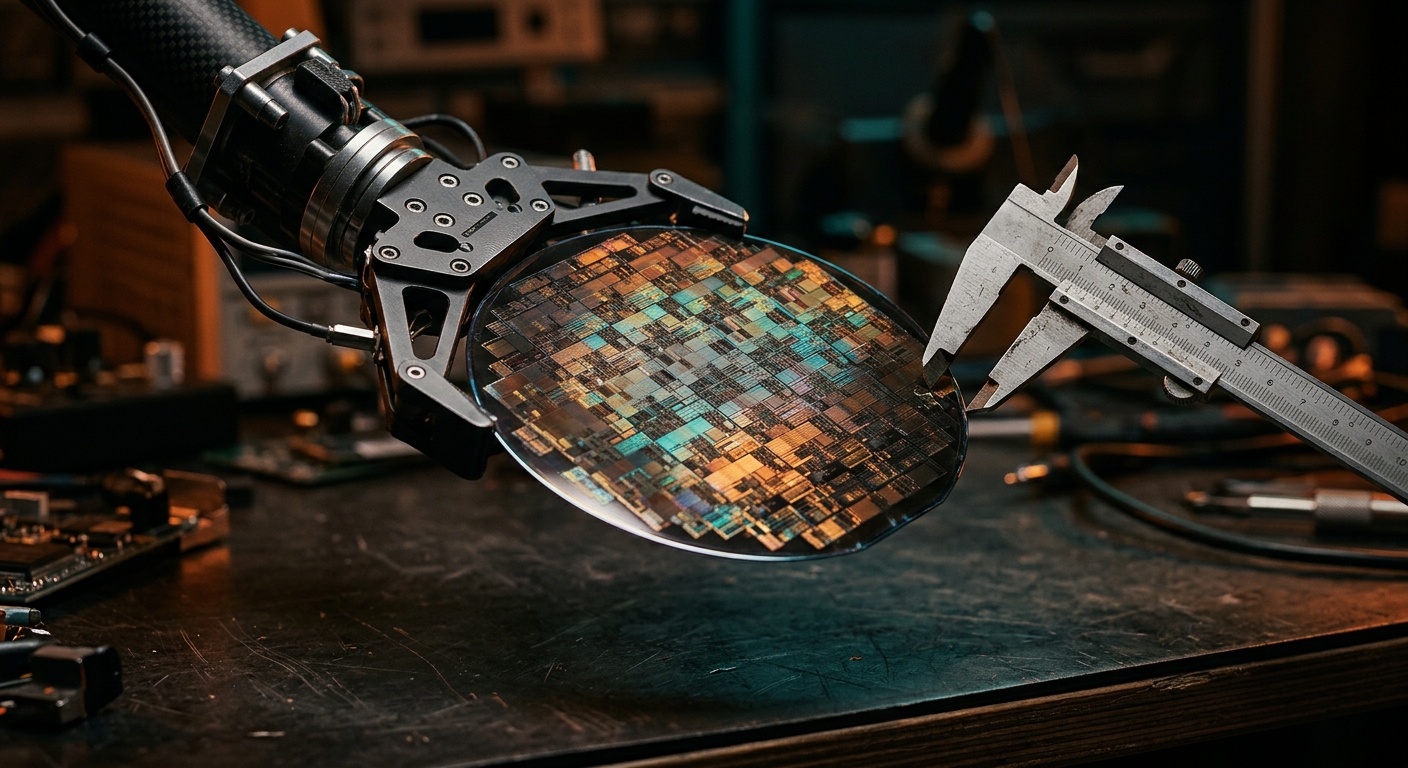
AI-generated illustration: the SSD casing removed, so software manages the raw memory chips directly.AI 生成示意圖:拆掉 SSD 外殼,由軟體直接管理裸記憶體顆粒。
View: Range-bound (was Buy). Target price: $151 (was $117).
研究觀點:區間(前次:買進)。目標價:$151(前次 $117)。
The target rose because on 09-23 the company gave its outlook for next year, and we raised expected profit per share from $3.55 to $4.57. The valuation multiple (the price as a multiple of next year's profit) stayed at 33 times.
目標價上調,是因為公司 9 月 23 日給了明年的展望,我們把明年每股獲利預估從 $3.55 調到 $4.57。估值倍數(股價是明年預估獲利的幾倍)維持 33 倍沒有變。
Not held: do not chase $147. Wait for $131 or lower, and for product gross margin to hold at 66% or more.
還沒持有:不要追 $147。等價格到 $131 以下,而且產品毛利率守住 66% 以上。
Held: keep holding. Consider trimming at $168 or higher, or if any pre-set warning line is crossed.
已持有:續抱。漲到 $168 以上,或任一條事先設定的警訊被觸發,就考慮減碼。
Personal research, not investment advice個人研究,非投資建議
A choke point is a step the whole industry stops without.
卡點,指少了它整個產業就會停擺的環節。
ROLENot a parts maker. It sells whole flash storage systems, run by its own software on raw memory chips, and now supplies software to two top-five cloud giants. Part of the bet rests on those two customers.
角色不是零件廠。它賣整套快閃儲存系統,用自家軟體直接管理原生記憶體顆粒,現在又替兩家前五大雲端業者供軟體。這項押注有一部分繫在這兩家客戶身上。
CHOKE TYPENot a choke point. Multi-year cloud qualification protects its industry position, not exclusive share. Cloud customers buy from two suppliers by design.
卡點類型不是卡點。多年期的雲端客戶認證,護住的是產業地位,不是獨佔份額。雲端客戶本來就會同時找兩家供應商。
RENTMostly the company keeps it, minus stock pay. Product gross margin gave up about two points to win share. Gross profit still grew 34% and adjusted operating margin rose 4.3 points to 19.4%. Adjusted profit sits far above GAAP profit, mainly because of stock pay, about 13% of revenue.
利潤守不守得住大部分留在公司,但要扣掉股票薪酬。產品毛利率讓出約兩個百分點,是為搶份額付的價錢。毛利金額仍年增 34%,調整後營業利益率升 4.3 個百分點到 19.4%。調整後獲利遠高於 GAAP 獲利,主因是股票薪酬,約占營收 13%。
ALREADY PRICED INThe price pays for profit growth, not for a change of role. The target rose on profit, and the 33 times did not move. The full size of the second cloud contract and a third customer are not in the price.
已經反映價格付的是獲利成長,不是角色改變。目標價上調來自獲利預估,33 倍沒有動。第二家雲端合約的全量與第三家客戶,還沒有算進價格。
Risk factors: NAND cost re-acceleration breaking the 65% product-GM floor · price-elasticity demand deferral · hyperscaler order lumpiness (two customers) · the 2027-28 NAND supply wave · 52.6× FY27E (32.2× on our FY28E) on a hardware-heavy mix · the multiple compressing before earnings do (see Numbers).
風險因子:NAND 成本再加速跌破 65% 產品毛利樓地板 · 高價引發需求遞延 · hyperscaler 訂單塊狀(僅兩家)· 2027-28 NAND 供給波 · 對硬體偏重的收入結構,FY27E 52.6 倍(我們的 FY28E 為 32.2 倍)· 倍數先於盈餘壓縮(見數字章)。
Sources for this section (consolidated here instead of inline): price & valuation = IBKR daily bars (10-06 close) + computed · results & guidance = 2QFY27 release 08-26 + earnings call · quarterly series = Q4FY26 slides + releases · hyperscaler deals = company PRs 08-11 + call + Blocks & Files · NAND prices = TrendForce (01-05 / 03-31 / 07-03 / 09-30) · FY28 outlook = 247wallst + Stocktwits (09-27) · consensus = stockanalysis (PT 09-26; EPS 08-31) · estimates, TP and view = this analysis ◆. Per-number ledger: see Sources.本節出處(統一註記於此,不逐句插標):價格與估值=IBKR 日K(08-31 收盤,建置時拉取)+本研究計算 · 財報與指引=2QFY27 release(08-26)+法說 · 季度序列=Q4FY26 簡報+各季 release · hyperscaler 合約=公司新聞稿(08-11)+法說+Blocks & Files · NAND 價格=TrendForce(01-05/03-31/07-03/09-30)· FY28 展望=247wallst+Stocktwits(09-27)· 共識=stockanalysis(目標價 09-26;EPS 08-31)· 預估、目標價與觀點=本研究判斷 ◆。逐數字查證表見〈資料來源〉章。
Formerly Pure Storage. Revenue is accelerating for the eighth straight quarter and a second top-five hyperscaler signed in August — yet the market sold the stock down 21% over a two-point gross-margin dip. Someone was reading the wrong scoreboard. Since then the market has caught up: the stock is up 59% in five weeks, and the company's early FY28 outlook moves our view from Buy to Range-bound. 前身是 Pure Storage。營收連續第八季加速、八月第二家 top-five hyperscaler 簽約 — 市場卻因毛利率掉了兩個百分點,把股價賣掉 21%。當時有一方看錯了記分板。之後市場追上來了:五週內股價漲 59%,加上公司提前公布的 FY28 展望,我們把觀點從買進改成區間。
What changed on 10-07:10-07 更新了什麼: On 09-23 the company gave an early, preliminary FY28 outlook that is far above our old estimate. We raised our FY28 profit estimate and the target to $151. But the stock rose 59% in five weeks and now sits at that target, so the view moves from Buy to Range-bound. The 33× multiple and every tripwire are unchanged. Details: Update log.9 月 23 日公司提前公布了明年(FY28)的初步展望,遠高於我們原本的估計。我們因此調高 FY28 獲利預估,目標價升到 $151。但股價五週漲了 59%,已經站在這個目標價旁邊,所以觀點從買進改成區間。33 倍的本益比,以及所有事先設定的警訊(這份報告稱為絆線),都沒有變。細節見〈更新紀錄〉。
(1) Growth is accelerating, not just growing. Quarterly revenue growth has climbed +12% → +13% → +16% → +20% → +35% → +38% over six quarters, the full-year guide was raised from $4.46B to $5.05B in one quarter (+38% for the year), and the order book (RPO, the contracted revenue not yet recognized) is up +44%. The second top-five hyperscaler signed on August 10 has not contributed a single dollar yet — its ramp is a fiscal-2028 event, with order visibility management describes as tens of exabytes into calendar 2028.
(1) 這不是「有成長」,是「成長還在加速」。季營收年增率六季連走 +12% → +13% → +16% → +20% → +35% → +38%;全年指引一季之內從 $4.46B 上修到 $5.05B(全年 +38%);訂單簿(RPO,已簽約未認列的收入)年增 +44%。而 8 月 10 日簽約的第二家 top-five hyperscaler(超大規模雲端業者)到今天為止一塊錢都還沒貢獻 — 它的放量是 FY28 的事,管理層給的能見度是「延伸到 2028 年、數十 EB」的訂單。
(2) The sell-off is about one number: product gross margin at 66.2%, the bottom of the company's 65-70% long-term band, with management saying out loud that it will stay there to win share. This analysis reads the same number differently. Gross profit dollars grew +34% year over year; operating margin expanded 4.3 points to 19.4%; the margin squeeze bottomed a quarter ago (65.5% → 66.2% sequentially) after price increases caught up with NAND (flash memory chips, the raw material of all storage) costs; and the hyperscaler revenue arriving from FY28 carries a 75-85% gross margin by management's own description, because the customer buys its own NAND. The market is pricing an incoming high-margin mix as if it were commodity erosion already underway. To be precise: commoditization is not yet proven — but not yet disproven either. What the numbers show so far is a floor-bounce after prices caught up with costs, not a structural recovery; this page’s tripwire (65%) sits exactly on that line.
(2) 這波賣壓押在一個數字上:產品毛利率 66.2%,落在公司自訂 65-70% 長期區間的底部,而且管理層明講會繼續待在底部換市占。本研究對同一個數字讀出不同的結論:毛利「金額」年增 +34%;營業利益率反而擴張 4.3 個百分點到 19.4%;毛利率的谷底其實在上一季(65.5% → 66.2% 環比回升),因為漲價已大致追上 NAND(快閃記憶體顆粒,儲存裝置的核心原料)的成本;而 FY28 起進帳的 hyperscaler 收入,管理層自述毛利率 75-85% — 因為 NAND 由客戶自己買。市場把「即將到來的高毛利組合」,定價成「已經發生的商品化侵蝕」。精確地說:商品化尚未被證實,但也還沒被證偽 — 眼前是漲價追上成本後的地板反彈,不是結構性回升;本頁的絆線(65%)就設在這條分界線上。
(3) The NAND shortage cuts both ways, and this page treats it as the central variable. Contract prices roughly doubled in the first half of 2026 — that is the margin squeeze — but scarcity also makes Everpure's architecture more valuable, not less: it buys raw NAND at the wafer level and wastes less of it per usable terabyte than commodity-SSD rivals, which is exactly why two hyperscalers signed during the squeeze. The honest risks sit on the other side of the same coin: customers paying more for less capacity may defer purchases, two hyperscalers are concentration, and the supply wave TrendForce dates to late 2027-2028 will eventually turn the cycle.
(3) NAND 短缺是一把雙面刃,本頁把它當成整個論點的中心變數。2026 上半年合約價大約翻倍 — 這就是毛利率被擠壓的來源 — 但稀缺同時讓 Everpure 的架構更值錢而不是更不值錢:它在晶圓層級買原生 NAND,每一 TB 可用容量浪費的 NAND 比買成品 SSD 的對手少,這正是兩家 hyperscaler 都選在短缺期間簽約的原因。誠實的風險在同一枚硬幣的另一面:客戶「花更多錢買更少容量」可能遞延需求;兩家 hyperscaler 是集中度;而 TrendForce 標在 2027 底-2028 的供給波,終究會讓循環轉向。
Start with what actually happened in August. On 08-11 the company announced it had won a second top-five hyperscaler design win — meaning Everpure's modules are now written into that cloud giant's standard datacenter blueprint, so every new build phase brings a new batch of orders. The stock jumped +11.6% that day and hit $118.16 by 08-14. Then on 08-26 came a quarterly report that beat on every line: revenue $1.19B (+38%, vs ~$1.1B expected), EPS $0.70 (vs $0.58), and the full-year outlook raised by $590M. A stock is supposed to rise on news like that. Instead it fell 21% in four sessions ✓ IBKR + releases.
先看八月發生了什麼事。08-11,公司宣布拿下第二家 top-five hyperscaler 的 design win(設計中標)— 意思是 Everpure 的模組被寫進了這家雲端巨頭的標準機房設計圖:以後它每蓋一批資料中心,就會跟著下一批訂單。股價當天 +11.6%,08-14 衝到 $118.16。接著 08-26 交出財報:營收 $1.19B(+38%,預期約 $1.1B)、EPS $0.70(預期 $0.58)、全年展望一口氣上修 $590M — 每一行都比市場預期好。照理說該漲,結果股價四個交易日跌掉 21% ✓ IBKR+財報。
What is the market afraid of? Two numbers — and both have checkable explanations. First, the hardware gross margin fell to 66.2%, right at the floor of the company's own 65-70% band. The reason: NAND — the memory chips that are its main raw material — roughly doubled in contract price during the first half of 2026 (TrendForce), and management chose not to pass all of that on. In plain terms, it is pricing for share: accepting a thinner profit on each deal to pull customers in, rather than pricing for margin — defending a prettier percentage while watching orders walk to competitors. Management said it out loud: "our goal is not to maximize gross margin." Second, free cash flow was negative this quarter (-$238M) — because the company stockpiled NAND ahead of time to lock in supply and hedge further price rises. A one-quarter inventory timing effect: the full-year cash guide is still a positive $600-800M ✓ call.
市場在怕什麼?兩個數字 — 而兩個都有可查證的解釋。第一個:賣硬體的毛利率掉到 66.2%,貼在公司自訂 65-70% 區間的地板上。原因是 NAND — 它最主要的原料、也就是快閃記憶體顆粒 — 2026 上半年合約價差不多翻倍(TrendForce),而管理層選擇不把漲幅全數轉嫁。講白話,這叫「為份額定價」:寧可每一單賺薄一點,也要把客戶搶進門;相對的是「為毛利定價」:守住漂亮的毛利率百分比,眼睜睜看訂單流向對手。管理層在法說會上說得很直接:「我們的目標不是毛利率極大化。」第二個:這一季自由現金流是負的(-$238M)— 因為公司提前囤了一批 NAND,一來鎖供貨、二來賭之後更貴。這是單季的庫存時點問題:全年現金流指引仍是正的 $600-800M ✓ 法說。
Here is the piece the tape is missing: selling to hyperscalers is a completely different business from selling to enterprises. In the enterprise business, Everpure buys the NAND itself, builds the full system, and eats the NAND cost — that is the 65-70% margin line everyone is staring at. In both hyperscaler contracts, the customer buys its own NAND, and Everpure supplies only the software and the non-NAND parts — a mix management says carries a 75-85% gross margin ✓ call recaps. That high-margin revenue lands mostly in 2HFY27 (customer #1) and FY28 (customer #2, with orders visible "into calendar 2028"). So the market is using today's squeezed margin to predict a worse tomorrow, while the actual schedule says tomorrow's incoming revenue is the high-margin kind.
盤面漏看的一塊:賣給 hyperscaler 和賣給企業,是兩種完全不同的生意。企業生意裡,Everpure 自己買 NAND、組成整套系統賣出去,NAND 成本吃在自己身上 — 大家盯著的 65-70% 毛利率就是這條線。而兩份 hyperscaler 合約裡,NAND 是客戶自己買,Everpure 只賣軟體和非 NAND 的部分 — 管理層說這種組合的毛利率有 75-85% ✓ 法說轉述。這塊高毛利收入主要落在 2HFY27(第一家)與 FY28(第二家,訂單能見度「延伸到 2028 年」)。換言之,市場拿「今天被擠壓的毛利」去推「明天會更慘」,但實際的排程表寫的是:明天進帳的,正是高毛利的那種收入。
Where this page could be wrong is just as specific. If December's report shows the margin breaking below 65%, if the cash-flow guide fails, if order-book (RPO) growth rolls under +30%, or if the 2027-28 NAND supply wave arrives early and freezes enterprise buying — then the market's read was right. Every one of those is written into the Catalysts table with a date and a pre-committed reaction. This is a thesis with scheduled examinations, not a story.
這個判斷哪裡可能錯,也一樣具體。如果 12 月初的財報毛利率跌破 65%、現金流指引失守、訂單簿(RPO)年增掉到 +30% 以下、或 2027-28 的 NAND 大擴產提前殺到、讓企業客戶停手觀望 — 那就是市場對了。這幾條全部寫進催化劑表,附日期、附預先承諾的反應,到期逐條打分。這是一個有考試日期的論點,不是一個故事。
One clarification first: the disagreement was with the tape, not the street. Sell-side was bullish at build (13 of 20 at Strong Buy; average target $130.53). A -21% de-rate in four sessions, on a quarter that beat expectations and raised guidance, was the market voting that the margin dip was the beginning of commoditization. This page voted the other way, on evidence. The tape has also caught up (the stock is +59% since 09-02), so the disagreement that justified Buy has closed — which is why the view is now Range-bound.
先講清楚:分歧的對象曾經是盤面,不是賣方。建頁時賣方是看多的(20 位中 13 位 Strong Buy、平均目標價 $130.53)。對價格行為的分歧在於:一份 beat-and-raise(優於預期+上修指引)的財報,換來四個交易日 -21% 的評價下修,等於市場投票說「毛利率下滑=商品化的開端」。這份報告根據證據投反對票。盤面也已經追上來(自 09-02 起股價 +59%),支撐「買進」的那個分歧已經收窄 — 所以觀點現在是區間。
And the honest other side, stated once more so the hero section doesn't oversell: if the 65% floor breaks, if RPO growth rolls under +30%, or if the 2028 supply wave lands early — the tape's read was right and this page executes its invalidation rows, not its conviction.
誠實的另一面再說一次,免得核心章節變成推銷:如果 65% 樓地板破了、RPO 年增滑落 +30% 以下、或 2028 供給波提前到 — 那就是盤面對了,本頁執行的會是失效條款,不是信仰。
A storage hardware company converting itself into a data-platform company — the rename is the mission statement. Pure Storage became Everpure on 2026-02-23 (ticker PSTG → P from 04-17; same legal entity, same CUSIP) ✓ PRs. Four building blocks:
一家正在把自己改造成資料平台公司的儲存硬體商 — 改名本身就是任務宣言。Pure Storage 於 2026-02-23 更名 Everpure(代號 PSTG → P 自 04-17 生效;同一法人、同一 CUSIP)✓ 公司新聞稿。生意由四塊組成:
All-flash storage systems with the Purity operating software inside: FlashArray runs databases and virtual machines; FlashBlade handles AI and unstructured data (files, images, logs). FY26: $1.97B, 53.8% of revenue ✓ Q4FY26. This is the line where the hyperscaler deals and the whole margin debate live.
內建 Purity 作業軟體的全快閃儲存系統:FlashArray 跑資料庫與虛擬機;FlashBlade 跑 AI 與非結構化資料(檔案、影像、log)。FY26 $1.97B、占營收 53.8% ✓ Q4FY26。hyperscaler 合約與整場毛利率之爭,都發生在這條線上。
Evergreen//One (pay for storage like a utility instead of buying hardware), Portworx container storage, cloud services. FY26: $1.69B, 46.2%, +15%; ARR now $2.13B (+20%) ✓ Q4FY26 · 2QFY27. Revenue that keeps flowing no matter where the hardware cycle sits.
Evergreen//One(像繳水電費一樣按用量付儲存費,不必買斷硬體)、Portworx 容器儲存、雲端服務。FY26 $1.69B、占 46.2%、+15%;ARR 已達 $2.13B(+20%)✓ Q4FY26・2QFY27。不管硬體循環走到哪,這塊都持續進帳。
14,500+ customers, including 64% of the Fortune 500, on an audited Net Promoter Score of 84 — one of the industry's highest ✓ slides. And the deals are getting bigger fast: transactions above $20M grew +385% YoY in 2QFY27 ✓ call.
客戶 14,500+ 家,含 Fortune 500 的 64%;稽核後 NPS 84 分 — 業界最高之一 ✓ 簡報。而且單子越做越大:2QFY27 超過 $20M 的交易年增 +385% ✓ 法說。
Enterprise Data Cloud (manage the whole fleet as one), the Fusion control plane, a Pure1 AI Copilot with MCP servers, an Azure-native service co-built with Microsoft(MSFT.O), and 1touch (data discovery/classification — acquired for $125M cash, closed May 2026, now folded into Data Intelligence/EDC; small, not a valuation driver) ✓ Q4FY26. Bonus tailwind: alternatives for VMware refugees (after Broadcom(AVGO.O)'s repricing) already run above $100M a year ✓ call.
Enterprise Data Cloud(把整個機隊當一台管)、Fusion 控制平面、含 MCP servers 的 Pure1 AI Copilot、與 Microsoft(MSFT.O) 共建的 Azure 原生服務、1touch(資料盤點/分類 — 2026-05 以 $125M 現金完成收購,已併入 Data Intelligence/EDC;金額小、非估值驅動項)✓ Q4FY26。額外紅利:VMware 難民(Broadcom(AVGO.O) 重定價後)的替代方案,年 run rate 已破 $100M ✓ 法說。
In one sentence: the subscription-and-software layer is the floor under the hardware cycle, and the hardware line is where the growth story is exploding.
一句話總結:訂閱與軟體層是硬體循環底下的地板,而成長故事的爆發點在硬體那條線上。
The one mechanism this whole thesis rides on: everyone else builds storage systems out of finished SSDs — sealed drives that each contain NAND chips plus their own controller, cache memory, and a hidden reserve of extra capacity (over-provisioning, typically ~20-28%) that the drive's firmware uses for housekeeping. Each drive manages itself blindly, unaware of the system around it. Everpure instead buys raw NAND and mounts it on its own DirectFlash Modules (DFM); all the housekeeping — where to write, when to erase, how to spread wear — is done once, globally, by the Purity software running across the whole array.
整個論點壓在一個機制上:其他人都用「成品 SSD」蓋儲存系統 — 每顆 SSD 是一個密封小盒,裡面有 NAND 顆粒、自己的控制器、快取記憶體,還有一塊藏起來的預留空間(over-provisioning,通常約 20-28%),給韌體做內部整理用。每顆硬碟只管自己、看不到整個系統。Everpure 反過來:直接買原生 NAND,裝在自家 DirectFlash 模組(DFM)上;所有整理工作 — 寫哪裡、何時抹除、磨損怎麼攤 — 由跑在整櫃系統上的 Purity 軟體「全域做一次」。
Why this matters more when NAND is scarce: in a shortage, the winner is whoever wastes the fewest NAND bits per usable terabyte. System-level management shrinks the hidden reserve, spreads wear globally, and makes cheap QLC NAND (4 bits per cell — denser but more fragile, needing smarter management) dependable at scale. 換言之,the same NAND crisis that squeezed this quarter's margin is the sales pitch for the architecture — and the supply side is secured by a QLC partnership with SK hynix(000660.KS) signed for hyperscale data centers ✓ Q4FY26.
為什麼 NAND 越缺、這件事越重要:短缺時代的贏家,是每一 TB「可用容量」浪費最少 NAND 位元的人。系統級管理把藏起來的預留空間縮到最小、把磨損攤到全域,也讓便宜的 QLC NAND(每格存 4 位元 — 更密但更脆弱、需要更聰明的管理)能大規模穩定商用。換言之,這一季擠壓毛利率的那場 NAND 危機,本身就是這套架構的銷售話術 — 而供給端由與 SK hynix(000660.KS) 簽的 hyperscale QLC 合作鎖住 ✓ Q4FY26。
Mechanism: ~15 years of Purity co-designed with its own hardware; rivals are locked to the SSD interface by their installed bases and firmware ecosystems. Erosion path: new interface standards (FDP/ZNS — ways to let commodity SSDs take orders from the system too) that hand back some of the system-level control, and hyperscalers writing their own flash management. Watch: OCP Global Summit (each ~Oct) — hyperscaler adoption of FDP/flexible-data-placement specs, and Meta/Google flash-management contributions.
機制:約 15 年的 Purity 軟硬體共同設計;對手被自己的安裝基礎與韌體生態綁在 SSD 介面上。侵蝕路徑:FDP/ZNS 等新介面標準(讓商品 SSD 也能聽從系統調度)把部分系統級控制還給商品硬碟;hyperscaler 自研快閃管理。觀察:OCP Global Summit(每年約 10 月)— FDP/彈性資料放置規格的 hyperscaler 採用聲量、Meta/Google 的快閃管理貢獻。
Mechanism: ARR $2.13B, NPS 84, non-disruptive upgrades — switching means data migration plus operations retraining. Erosion: VAST-style subscription rivals winning new logos. Watch: ARR growth slipping under +15%.
機制:ARR $2.13B、NPS 84、不中斷升級 — 換掉它=資料搬遷+維運重訓。侵蝕:VAST 型訂閱對手搶新客戶。觀察:ARR 年增滑落 +15% 以下。
Mechanism: wafer-level buying at scale plus the SK hynix QLC partnership — cost and supply access rivals buying finished enterprise SSDs (the tightest NAND segment per TrendForce) don't have. Erosion: NAND makers selling DFM-like raw modules directly. Watch: FMS (each Aug) / CES — whether Solidigm, Samsung or Kioxia launch bare-NAND "DFM-like" module lines.
機制:晶圓級規模採購+SK hynix QLC 合作 — 對手買的是成品企業 SSD(TrendForce 口中最緊的一段),成本與供給取得都吃虧。侵蝕:NAND 廠自己出「類 DFM」原生模組。觀察:FMS(每年 8 月)/CES — Solidigm、Samsung、Kioxia 是否發表裸顆粒「類 DFM」模組產品線。
Mechanism: multi-year qualification and co-engineering; two top-five references now exist. The honest caveat: hyperscalers dual-source by design — this moat protects the industry position, not exclusive share. Watch: any competing raw-flash design win at a top-five.
機制:多年期認證+深度共構;現在有兩家 top-five 當參考案例。誠實但書:hyperscaler 天生雙供應商 — 這條河護的是「產業地位」,不是獨佔份額。觀察:任何競品在 top-five 拿下 raw-flash design win。
Leading indicators, all public: (1) TrendForce quarterly price releases — the NAND-wafer vs enterprise-SSD spread (current: 09-30 TrendForce — wafer pricing "modest", enterprise-SSD price growth accelerating in 4Q26) = Everpure's relative cost edge; (2) hyperscaler capex guides each earnings season = the upstream water level for exabyte orders; (3) NetApp's all-flash growth — latest: FQ1 +47% raw / ≈+41% adjusted (confirmed 09-03: the industry is rising; the gauge now = the growth-gap multiple, currently ~1.5×); (4) Everpure's own RPO growth (now +44%; tripwire <+30%); (5) NAND-maker capex announcements = early warning for the 2028 supply wave.領先指標(全部公開可查):(1) TrendForce 季度價格稿 — NAND wafer 與企業 SSD 的價差(現況:TrendForce 09-30 — wafer 價格「溫和」、企業 SSD 4Q26 漲幅加速)=Everpure 的相對成本優勢;(2) 各家 hyperscaler 財報季的 capex 指引=EB 訂單的上游水位;(3) NetApp all-flash 成長率 — 最新讀數 FQ1 +47%/調整後約 +41%(09-03 證實整個產業在漲;儀表改看「成長差倍率」,現約 1.5 倍);(4) Everpure 自己的 RPO 年增(現 +44%;絆線 <+30%);(5) NAND 廠 capex 宣布=2028 供給波預警。
Each chain reads left to right: the upstream trend → the mechanism that transmits it → what actually ramps. The tag inside the last box says whether it is structural or cyclical.每條鏈由左讀到右:上游趨勢 → 傳導機制 → 真正放量的東西。最右框內的小字標注它是結構性還是循環性。

Full-year growth guided at +38% with two quarters already delivered; the guide was raised $590M in a single quarter; and the order book (RPO) is up +44% to $4.09B. Management is raising on contracts already signed, not on hope ✓.
兩季實績在手、全年指引 +38%;指引單季上修 $590M;訂單簿(RPO)+44% 至 $4.09B。管理層是用已簽下的合約上修,不是用願望 ✓。
Deal #2 contributes $0 to FY27 ("de minimis"), and its visibility — "tens of exabytes into calendar 2028, a multiple of this year's expectations" — is not in an FY28 consensus last calibrated before the Q2 report ✓ call.
deal #2 在 FY27 貢獻是零(de minimis);「數十 EB、延伸到 2028、數倍於今年預期」的能見度,也還不在上次於 Q2 財報前校準的 FY28 共識裡 ✓ 法說。
Hyperscaler revenue carries 75-85% gross margin (management's figure) because the customer buys its own NAND. The mix the market fears is precisely the mix about to improve.
hyperscaler 收入毛利率 75-85%(管理層數字),因為 NAND 由客戶自己買。市場害怕的那個組合,正是即將變好的那個組合。
In the same quarter the gross margin "collapsed," operating margin expanded +430bp YoY to 19.4%; FY27 operating income is guided +50% on +38% revenue ✓.
毛利率「崩壞」的同一季,營益率年增 +430bp 到 19.4%;FY27 營益指引 +50%、營收 +38% ✓。
Even after the Q2 NAND stockpile, FY27 free cash flow is guided at $600-800M; FY26 actually delivered $616M ✓.
即使 Q2 囤了 NAND,FY27 自由現金流指引仍是 $600-800M;FY26 實績 $616M ✓。
Management is volunteering to live at the bottom of the 65-70% band. If NAND costs re-accelerate (TrendForce's 3Q moderation is one quarter, not yet a trend) while price pass-through fatigues, 66.2% becomes 64-something — and the market's August verdict gets vindicated.
管理層是自願住在 65-70% 區間的底部。如果 NAND 成本再加速(TrendForce 的 3Q 放緩只有一季、還算不上趨勢)而漲價轉嫁開始疲乏,66.2% 就會變成 64 字頭 — 屆時 8 月市場的判決就是對的。
Analysts on the call flagged customers paying more for less capacity; demand pulled forward ahead of price hikes can reverse into H2, and the Q1 pull-forward question was never fully settled ✓ call. Sized: if H2 capacity growth goes to zero and only pricing remains, FY27 revenue lands around $4.9-5.0B (below the guide floor) and EPS ~$2.6-2.7 — and product GM would look deceptively better on pure price. Good-looking margin plus negative capacity growth is the overdraft signature ◆.
法說上分析師點名:客戶在「花更多錢買更少容量」。趕在漲價前提前拉的貨,下半年可能反噬;Q1 的提前拉貨疑問也從沒被完整回答 ✓ 法說。量化:若 H2 容量成長歸零、只剩漲價,FY27 營收約落在 $4.9-5.0B(跌破指引下緣)、EPS 約 $2.6-2.7 — 而且產品毛利率會因純漲價反而「虛胖」。毛利率好看+容量負成長,才是需求透支的訊號組合 ◆。
Operating cash flow was -$136M this quarter; stock compensation runs ~13% of revenue (FY26 $482M), so the GAAP operating margin is just 5.3% while the valuation runs on non-GAAP. The 33× is paid on the generous ledger ✓.
本季營運現金流 -$136M;股票薪酬約占營收 13%(FY26 $482M),GAAP 營益率只有 5.3%,而估值用的是 non-GAAP。33 倍是付在比較寬鬆的那本帳上 ✓。
Two hyperscaler customers; exabyte orders follow construction schedules, so air pockets between build phases are possible; international revenue jumped to 42% in one quarter ✓ call.
hyperscaler 客戶只有兩家;EB 訂單跟著工程時程走,建設階段之間可能出現訂單空窗;國際占比單季跳到 42% ✓ 法說。
TrendForce dates meaningful new NAND capacity to late 2027/2028. When NAND turns down, the peak-priced inventory marks down, the efficiency pitch loses urgency, and buyers wait for cheaper $/TB.
TrendForce 把有意義的 NAND 新產能標在 2027 底/2028。NAND 一轉跌:高價囤的庫存要跌價、「省料」賣點的急迫性下降、買家會停下來等更便宜的 $/TB。
The elasticity risk above turns into four concrete dials. The dangerous pattern is not an ugly margin — it is a good-looking margin sitting on shrinking units.
上面的彈性風險,落地成四個具體儀表。危險的形態不是難看的毛利率 — 是「好看的毛利率坐在萎縮的出貨量上」。
| Dial觀察 | Healthy健康 | Overdraft透支 |
|---|---|---|
| Mgmt on capacity vs price (calls)管理層談容量 vs 價格(法說) | capacity still growing; price the second factor容量仍正成長;漲價是第二因子 | "pricing-led, units declining"「以定價為主、單位數下滑」 |
| Product GM產品毛利率 | 65-67% with cost-offset language65-67% 且提到成本對沖 | >68% driven by price alone>68% 但只靠漲價撐 |
| Large deals / RPO大單/RPO | RPO ≥+30%, $5M+ deals still climbingRPO ≥+30%、$5M+ 大單續增 | deal counts fading, RPO propped by price大單數轉弱、RPO 靠漲價堆出來 |
| FCF自由現金流 | $600-800M guide intact$600-800M 指引不動 | another stockpile quarter or a guide cut再一季戰備採購、或指引下修 |
◆ Scored each quarter alongside the catalyst table; two dials in the overdraft column at once = treat as a tripwire even if GM looks fine.與催化劑表一起逐季打分;任兩個儀表同時落在「透支」欄,即視同絆線 — 就算毛利率看起來沒事。
The fear (commoditization) → the company's claim (a deliberate share strategy; hyperscaler margin accretive) → the independent evidence (gross margin up sequentially, operating margin expanding, wafer costs moderating) → this page's ruling: commoditization is not proven within FY27 — but the 65% line is a hard tripwire, not a debating point.
恐懼(商品化)→ 公司說法(刻意的份額策略;hyperscaler 毛利增益)→ 獨立證據(毛利率環比回升、營益率擴張、wafer 成本放緩)→ 本頁裁決:FY27 之內「商品化」不成立 — 但 65% 那條線是硬絆線,不是辯論題。
Team and ownership. Chairman & CEO Charles Giancarlo (ex-Cisco); CFO Tarek Robbiati; CTO & Growth Rob Lee. Founder John "Coz" Colgrove remains the largest individual holder at 2.59% ✓; institutions hold 81.2%, insiders 8.6% overall ✓ WallStreetZen. On individual insider trades: 2026 Form 4 filings are frequent, this page has not audited them item-by-item, so it cites no named transaction.
團隊與持股。董事長兼 CEO Charles Giancarlo(Cisco 出身);CFO Tarek Robbiati;CTO 兼成長長 Rob Lee。創辦人 John "Coz" Colgrove 仍是個人最大股東(2.59%)✓;整體機構持股 81.2%、內部人 8.6% ✓ WallStreetZen。個別內部人交易:2026 年 Form 4 申報頻繁,本頁未逐筆查核,故不引用任何具名交易。
Capital allocation — and the one honest flag. No dividend; buybacks of $343M in FY26 plus $84M / $69M in 1Q/2Q FY27 — roughly offsetting dilution rather than shrinking the share count ✓ releases; one small acquisition pending (1touch). The flag: stock-based compensation ran $482M in FY26, about 13% of revenue. That is why the GAAP operating margin (3.1% FY26 / 5.3% 2QFY27) sits so far below the non-GAAP 17-19% this page's valuation uses — the dilution is real even when the adjusted numbers look clean ✓.
資本配置 — 與一支誠實的旗子。不配息;庫藏股 FY26 $343M、1Q/2Q FY27 各 $84M/$69M — 大致只抵銷員工配股的稀釋,沒有真的縮小股本 ✓ 財報;一件小型收購進行中(1touch)。旗子是:FY26 股票薪酬 $482M,約占營收 13%。這就是 GAAP 營益率(FY26 3.1%/2QFY27 5.3%)遠低於本頁估值所用 non-GAAP 17-19% 的原因 — 調整後的數字再漂亮,稀釋都是真的 ✓。
The first scheduled examination came back — verdict: the whole industry is booming. NetApp(NTAP.O)'s FQ1 FY27 (reported 09-02): revenue $2.025B, +30% YoY — a 14-week quarter, so normalized for the extra week (~$65M, guidance-vintage figure) ≈ +26%; all-flash a record $1.3B, +47% raw / ≈+41% normalized ✓ NetApp PR 09-02. Against this page's pre-committed threshold (>+10% → the industry is rising, dial down the share story), the outcome went against this page — so we executed the promised reaction: the gap is now ~1.5× (+38% vs ≈+26%). The honest read: an industry-wide AI-storage supercycle in which Everpure grows meaningfully faster, not a lone share-taker. What the print did not weaken: the demand chains (the tide is real and violent — it corroborates them) and the NAND-scarcity logic.
第一場排定的考試放榜了 — 結果是:整個產業都在大漲。NetApp(NTAP.O) FQ1 FY27(09-02 發布):營收 $2.025B、+30% — 本季有 14 週,扣掉多出的一週(約 $65M,指引期口徑)正規化後約 +26%;all-flash 創紀錄 $1.3B、+47%(正規化約 +41%)✓ NetApp 新聞稿 09-02。對照本頁預先綁定的門檻(>+10% → 整個產業在漲、「搶份額」說法要調弱):結果落在對本頁不利的那一邊 — 照約定執行:現在的成長差約 1.5 倍(+38% 對 ≈+26%)。誠實的讀法:這是一場產業級的 AI 儲存超級循環,Everpure 是「跑得明顯較快的一員」,不是「唯一在搶份額的人」。這份財報沒有削弱的:需求傳導鏈(潮水又真又猛 — 反而是佐證)與 NAND 稀缺邏輯。
The valuation echo is the more striking datapoint. NetApp beat and raised (FY27 guide now $7.975-8.225B, EPS $9.73-10.03) — and still closed $180.77 (-1.3%), then fell another ~8.7% after hours to ~$165 ✓ stockanalysis 09-02. That is the same sold-despite-beating pattern as Everpure's own August: the market is compressing the whole AI-storage complex's multiple. On the new guide midpoint (EPS $9.88), NetApp's forward PE ≈ 18.3× at the close and ≈16.7× at the after-hours print ✓ computed計算 — live evidence for this page's multiple-risk paragraph (Numbers chapter): compression can arrive before any earnings miss does. Basis note: Everpure's FY27E multiple was 33.2× at the 09-02 close (52.6× at the 10-06 close); NetApp's multiples here are 09-02 vintage and were not re-pulled ⚠ 09-02, not re-pulled⚠ 09-02,未重取 — a growth-gap anchor, not precision relative value.
估值端的回聲比成長數字更值得看。NetApp beat 加上修指引(FY27 指引 $7.975-8.225B、EPS $9.73-10.03)— 收盤仍 -1.3% 至 $180.77,盤後再跌約 -8.7% 至 ~$165 ✓ stockanalysis 09-02。這正是 Everpure 八月的同一個劇本:市場在壓縮整個 AI 儲存板塊的倍數。以新指引中值(EPS $9.88)計,NetApp forward PE 收盤約 18.3×、盤後價約 16.7× ✓ 計算 — 本頁〈數字〉章「倍數風險」段落的活教材:倍數壓縮可以先於任何獲利 miss 到貨。口徑註記:Everpure 的 FY27E 倍數在 09-02 收盤為 33.2×(10-06 收盤為 52.6×);此處 NetApp 的倍數是 09-02 的讀值,未重取 ⚠ 09-02,未重取 — 只作成長差之錨、不作精密相對估值。
The rest of the field, honestly sized. Dell(DELL.N), HPE(HPE.N) and Hitachi Vantara compete in enterprise arrays (no clean free disclosures — not quantified here); VAST Data, private and AI-focused, is the aggressive newcomer (no public financials). The structural threats worth real respect are not the array vendors at all: they are hyperscalers building storage in-house, and NAND makers moving up the stack to sell smarter modules themselves.
其他對手,誠實秤重。Dell(DELL.N)、HPE(HPE.N) 與 Hitachi Vantara 在企業陣列同場競爭(缺乾淨的免費揭露 — 本頁不量化);VAST Data 是私有、主攻 AI 的兇悍新兵(無公開財務)。真正值得敬畏的結構性威脅其實不是陣列同業:是自己下場做儲存的 hyperscaler,和往上走、想自己賣聰明模組的 NAND 廠。
| FY25A | FY26A | FY27E | FY28E | |
|---|---|---|---|---|
| Revenue ($M)營收 ($M) | 3,168 ✓ | 3,663 ✓ | 5,050 ◆ guide | 7,150 ◆ outlook midpoint◆ 展望中點 |
| YoY | +11.9% | +15.6% | +37.9% | +41.6% |
| Gross margin (non-GAAP)毛利率 (non-GAAP) | 71.8% ✓ | 72.1% ✓ | ~69.9% ◆ | ~70.3% ◆ |
| Op. margin (non-GAAP)營益率 (non-GAAP) | 17.7% ✓ | 17.3% ✓ | 18.8% ◆ guide | 23.8% ◆ outlook low end◆ 展望低端 |
| EPS (non-GAAP) | ≈1.63 ◆ derived推導 | ≈1.96 ◆ derived推導 | 2.80 ◆ | 4.57 ◆ |
| Free cash flow ($M)自由現金流 ($M) | 527 ✓ | 616 ✓ | 700 ◆ guide 600-800 | ~900 ◆ |
| PER @ $147.20 | — | 75.1× | 52.6× | 32.2× |
TP:目標價: FY27/FY28 non-GAAP EPS $2.80 / $4.57 gives a target of $151 (was $117): FY28E $4.57 times a 33× forward PER (6-month horizon). The 33× is this research's own anchor, held since the page was built, inside the ~23–48× range observed through 2026 (approximated from price divided by the then-current consensus). It is not today's market multiple: the market pays 52.6× our FY27E and 32.2× our FY28E. The target moved because EPS moved (3.55 to 4.57, +28.7%); the multiple did not — an earnings upgrade, not a re-rating. Implied +2.6% from $147.20. Multiple risk is still separate from earnings risk: even if EPS lands, an early re-pricing of the 2028 NAND supply wave, another negative-FCF quarter, or softer hyperscaler capex could compress the multiple to 26-28× first — $119–128 on $4.57, which is 13-19% below today's price. FY27/FY28 non-GAAP EPS $2.80/$4.57,得出目標價 $151(前次 $117):FY28E $4.57 乘以 33 倍 forward PER(6 個月)。33 倍是這份報告自建頁起持有的錨,落在 2026 年觀察到的約 23–48 倍區間之內(本研究以「價格除以當時共識」近似)。它不是今天市場的倍數:市場對我們的 FY27E 付 52.6 倍、FY28E 付 32.2 倍。目標價會動是因為 EPS 動了(3.55 到 4.57,+28.7%),倍數沒動 — 這是獲利上修,不是重新評價。對 $147.20 隱含 +2.6%。倍數風險與盈餘風險仍是兩回事:即使 EPS 如期交付,若 2028 NAND 供給波被提前定價、FCF 再負一季、或 hyperscaler capex 轉弱,倍數可能先壓到 26-28×(對 $4.57 即 $119–128,比今天價格低 13-19%)。 ◆
| Scenario情境 | Swing variables關鍵變數 | FY28E EPS | PER | Implied隱含價 |
|---|---|---|---|---|
| Bear · 25% | Hyperscaler deal #2 slips out of FY28 (revenue $6,300M, op margin 18.5%, op income ~$1,166M); NAND cost re-accelerates and breaks the 65% GM floor; high prices defer enterprise demandhyperscaler 第二家訂單延出 FY28(營收 $6,300M、營益率 18.5%、營業利益約 $1,166M);NAND 成本再加速、跌破 65% 毛利樓地板;高價遞延企業需求 | 3.16 | 24× | $76 (-48%) |
| Base · 50% | FY27 guide delivered; the low end of the FY28 outlook delivered (revenue $7,150M, op income $1,700M); product GM holds the lower half of 65-70%FY27 指引達成;FY28 展望的低端達成(營收 $7,150M、營業利益 $1,700M);產品毛利率守住 65-70% 區間下半 | 4.57 | 33× | $151 (+2.6%) |
| Bull · 25% | The top end of the FY28 outlook (revenue $7,300M, op income $1,900M), or a third hyperscaler signs; GM recovers toward 68% as the high-margin mix landsFY28 展望的高端(營收 $7,300M、營業利益 $1,900M),或第三家 hyperscaler 簽約;高毛利組合進帳、毛利率回升向 68% | 5.09 | 40× | $204 (+39%) |
These are the raw readings behind the verdict: price, valuation, ownership, order book and subscriptions. Each cell carries its own date and source.
這一組是結論背後的原始讀數:價格、估值、持股、訂單簿與訂閱。每一格都標了自己的日期與來源。
Basis: FY27E revenue/op income = company guide midpoints (raised 08-26 from $4.41-4.51B / $820-860M). FY28E = the company's preliminary outlook from the 09-23 Financial Analyst Meeting: revenue $7.0–7.3B (we use the midpoint, $7,150M, +41.6%) and non-GAAP operating income $1.7–1.9B (we use the low end, $1,700M, 23.8% margin — the outlook is about 16 months before the fiscal year ends, so we lean conservative; the company calls it preliminary and the range may narrow) ✓ 247wallst · Stocktwits. FY28E EPS $4.57 equals ($1,700M operating income + ~$40M other income) × (1 minus the 7.1% tax rate), divided by 354M diluted shares. Other income was cut from ~$110M to ~$40M: Q2FY27 other income was $9.0M against $45.7M a year earlier (first half $22.9M against $77.4M) because cash went into NAND pre-buys (Q2 free cash flow -$238M) ✓ Q2FY27 release. Shares: Q2FY27 diluted 345.6M against 337.7M a year earlier (+2.3% a year), rolled forward one year to 354M. Historical non-GAAP EPS derived from GAAP + adjustments per the company's own reconciliation convention; FY27E EPS $2.80 cross-checks consensus $2.78 (stockanalysis, 20 analysts; TradingView 2.777 on 10-06) — this analysis vs consensus: +0.7% on EPS, in line on revenue. FY28 consensus EPS: not obtained (paywalled), so no FY28 consensus is shown. GAAP note: FY26 GAAP EPS $0.55, GAAP op margin 3.1% — the non-GAAP gap is mostly stock compensation (see Management). The TP's implicit assumption: SBC grows slower than revenue so today's ~13% ratio dilutes; if SBC keeps pace, buybacks merely offset dilution and the per-share quality of that $4.57 is a notch lower — GAAP-margin convergence stays a check item from FY28.估算依據(供查核,可跳過):FY27E 營收/營益=公司指引中值(08-26 自 $4.41-4.51B/$820-860M 上修)。FY28E=公司 09-23 財務分析師會議給的初步展望:營收 $7.0–7.3B(我們取中點 $7,150M,+41.6%)、公司自訂(non-GAAP)營業利益 $1.7–1.9B(我們取低端 $1,700M、營益率 23.8% — 展望離 FY 結束約 16 個月,所以偏保守;公司說這是初步數字、範圍可能收窄)✓ 247wallst · Stocktwits。FY28E EPS $4.57 等於(營業利益 $1,700M+業外收入約 $40M)乘以(1 減稅率 7.1%),再除以稀釋股數 354M。業外收入由約 $110M 下修為約 $40M:Q2FY27 業外收入 $9.0M,去年同期 $45.7M(上半年 $22.9M 對 $77.4M),因為現金拿去預購 NAND(Q2 自由現金流 -$238M)✓ Q2FY27 release。股數:Q2FY27 稀釋股 345.6M,去年同期 337.7M(年增 2.3%),往後推一年得 354M。歷史 non-GAAP EPS 依公司 reconciliation 慣例由 GAAP+調整項推導;FY27E EPS $2.80 與共識 $2.78 交叉(stockanalysis,20 位;TradingView 10-06 為 2.777)— 本研究 vs 共識:EPS +0.7%、營收持平。FY28 共識 EPS:未取得(付費牆),所以不列 FY28 共識。GAAP 註記:FY26 GAAP EPS $0.55、GAAP 營益率 3.1% — 與 non-GAAP 的落差主要是股票薪酬(見經營層)。目標價的隱含假設:SBC 絕對額成長慢於營收、今天約 13% 的占比逐步稀釋;若 SBC 跟營收同速,買回只抵銷稀釋,$4.57 的「每股」品質就打折 — FY28 起 GAAP 營益率是否向上收斂仍列入檢驗。
| Item項目 | Revised調整後 | Prior調整前 | Change差異 | Consensus市場共識 | vs cons.差異 |
|---|---|---|---|---|---|
| FY28E revenue ($M)營收 ($M) | 7,150 | 6,300 | +13.5% | not obtained未取得 | — |
| FY28E op. income ($M)營業利益 ($M) | 1,700 | 1,230 | +38.2% | not obtained未取得 | — |
| FY28E op. margin營益率 | 23.8% | 19.5% | +4.3pt | not obtained未取得 | — |
| FY28E EPS | 4.57 | 3.55 | +28.7% | not obtained未取得 | — |
| FY27E revenue ($M)營收 ($M) | 5,050 | 5,050 | 0% | 5,050 | 0% |
| FY27E EPS | 2.80 | 2.80 | 0% | 2.78 | +0.7% |
Prior values come from the model snapshot archived before this update. FY27E consensus: stockanalysis 08-31 (EPS also 2.777 on TradingView, 10-06). FY28 consensus EPS sits behind a paywall, so it is shown as "not obtained" rather than guessed. ◆調整前數值取自本次更新前存檔的模型快照。FY27E 共識:stockanalysis 08-31(TradingView 10-06 的 EPS 也是 2.777)。FY28 共識 EPS 在付費牆後面,所以寫「未取得」,不猜。◆
The base case no longer comes from this bridge. Since 09-23 FY28 revenue is anchored on the company's own preliminary outlook ($7.0–7.3B; we use $7,150M), which is $850M above the $6,300M this bridge adds up to. The company does not split its outlook into core and hyperscaler parts, so we draw no new bridge. This one stays for two reasons: it shows how the old estimate was built, and $6,300M is the revenue of the bear case below.基準情境現在不再由這張橋推出。自 09-23 起,FY28 營收以公司自己的初步展望為錨($7.0–7.3B;我們取 $7,150M),比這張橋加總出的 $6,300M 高 $850M。公司沒有把展望拆成核心與 hyperscaler 兩塊,所以我們不畫新的橋。這張橋保留有兩個理由:它說明舊估計怎麼來,而且 $6,300M 就是下方空方情境的營收。
| Piece拆解 | FY27E ($M) | FY28E ($M) | Δ | Assumption假設依據 |
|---|---|---|---|---|
| Core (enterprise + subscription)核心(企業+訂閱,非 hyperscaler) | ≈4,550 ◆ | ≈5,140 ◆ | +590 | core slows to +13% as price hikes lap and elasticity bites核心降速至 +13%(漲價基期墊高+彈性壓力) |
| Hyperscaler deal #1 | ≈500 ◆ range 400-600帶 400-600 | ≈850 ◆ | +350 | low-double-digit exabytes annualizing into a full year低雙位數 EB 全年化 |
| Hyperscaler deal #2 | ~0 | ≈300 ◆ | +300 | first meaningful ramp year of "tens of exabytes into CY2028"「數十 EB into CY2028」的第一段 |
| Total合計 | 5,050 | ≈6,300 | +1,250 | +24.8% |
On the earlier $3.55 build — stress test, deal #2 slips two quarters: FY28 loses ~$150-200M of high-margin revenue → EPS falls to ~$3.15-3.25 → ×33 = $104-107 (still above today's price); if the multiple compresses to 28× at the same time, $88-91. The bear-case EPS of $2.55 is NOT this single slip — it is slip + core slowdown + the 65% floor breaking, stacked. The elasticity stress (H2 capacity growth at zero) lives in the Bear section: revenue ~$4.9-5.0B, EPS ~$2.6-2.7. The "$300M vs tens of exabytes" relationship, spelled out: the deal-1 assumption implies roughly $35-45M per exabyte ($500M ÷ low-double-digit EB); deal-2's $300M is ~7-8 EB-equivalents — it does not discount "tens of exabytes" into FY28, it is only the floor of a first ramp year. If deal-2 recognition runs clearly above $400M within FY28, that triggers an upgrade review, not a risk. The FY28 GM 70.3% mix check: HS $1.15B × 80% + core $5.15B × 68.1% ≈ 70.3% — the hyperscaler accretion (~+1.9pt of contribution) net of a deliberately conservative core-margin slide (68.8% → 68.1%, share war continuing, no cost-reversal credit). In other words, $3.55 is mostly revenue scale plus expense leverage; the mix accretion contributes only a sliver — conservative by design, not a contradiction.以先前 $3.55 的版本計 — 壓力測試,deal #2 延後兩季:FY28 少掉約 $150-200M 高毛利收入 → EPS 掉到約 $3.15-3.25 → ×33 = $104-107(仍高於現價);若倍數同時壓縮到 28×,則 $88-91。注意:空方情境的 EPS $2.55 不是「單一延後」— 是延後+核心放緩+65% 樓地板破功三者疊加。彈性壓力測試(H2 容量成長歸零)放在空方章:營收約 $4.9-5.0B、EPS 約 $2.6-2.7。「$300M vs 數十 EB」的關係講白:deal-1 的假設隱含每 EB 約 $35-45M($500M ÷ 低雙位數 EB);deal-2 的 $300M ≈ 7-8 EB 等值 — 它不是把「數十 EB」折現進 FY28,只是首年爬坡的地板。若 FY28 年內 deal-2 認列明顯超過 $400M,構成上修檢討,不是風險。FY28 GM 70.3% 的 mix 驗算:HS $1.15B × 80% + 核心 $5.15B × 68.1% ≈ 70.3% — 即「HS 增益(約 +1.9pt 貢獻)被核心毛利假設續滑(68.8% → 68.1%,份額戰延續、未押成本反轉)稀釋後的淨結果」。換言之,$3.55 的成長主要靠營收規模+費用槓桿,mix 增益只貢獻小部分 — 這是刻意保守,不是矛盾。 ◆
Anchor reconciliation: the canonical number is the TP $151, which equals the base scenario by construction; the probability-weighted $145 sits about 4% lower purely because of the bear tail, and is 1.5% below the $147.20 close. EPS math for the two outer cases: bear is ($1,166M plus about $40M other income), times (1 minus 7.1% tax), divided by 354M shares: $3.16. Bull is ($1,900M plus about $40M), times (1 minus 7.1%), divided by 354M: $5.09. One line on asymmetry: from $147.20 the bull case adds +39% while the bear case takes away -48%, and the weighted value sits slightly under the price — that skew is why the view is Range-bound, not Buy.錨定調和:正典數字是目標價 $151(依構造即等於基準情境);機率加權 $145 低約 4%,純粹來自空方尾部,也比 $147.20 的收盤價低 1.5%。兩個外側情境的 EPS 算式:空方是($1,166M 加業外收入約 $40M)乘以(1 減稅率 7.1%),再除以 354M 股:$3.16。多方是($1,900M 加約 $40M)乘以(1 減 7.1%),再除以 354M 股:$5.09。不對稱一句話:從 $147.20 出發,多方情境多賺 +39%,空方情境少賺 -48%,加權價值略低於現價 — 這個偏斜就是觀點是區間、不是買進的原因。 ◆
Every dated event carries a pre-committed if-then against this page's model; thresholds are committed in advance and never edited after the fact. Past-due rows are scored in the Update log: NetApp (09-03), the FY28 outlook (09-23) and TrendForce (09-30) are done.每個有日期的事件都預先綁一條 if-then;門檻為預先承諾、事後不改。已到期的列都在〈更新紀錄〉打分:NetApp(09-03)、FY28 展望(09-23)、TrendForce(09-30)已完成。
| When時間 | Event事件 | Threshold → reaction門檻 → 反應 | Status狀態 |
|---|---|---|---|
| 2026-09-02 | NetApp(NTAP) FQ1 FY27 print — the closest listed competitor; its all-flash growth is the control group that separates "the whole industry is rising" from "Everpure is taking share"NetApp(NTAP) FQ1 FY27 財報 — 最接近的上市競爭對手;它的 all-flash 成長率是對照組,用來分辨「整個產業都在漲」還是「Everpure 在搶份額」 | all-flash growth <+5% → share-gain case strengthens; >+10% → industry tide, share story discountedall-flash 成長 <+5% → 搶份額論證強化;>+10% → 產業水漲、份額故事打折 | resolved 09-03已結案 09-03 all-flash +47% (≈+41% adj.) → "whole industry rising" side won; as promised: Competition rewritten, share argument dialed downall-flash +47%(調整後≈+41%)→「整個產業在漲」那邊成立;照約定:競爭章重寫、「搶份額」論點調弱 |
| 2026-09-23 | First FY28 guide — due 2027-02/03, arrived early as a preliminary outlook at the Financial Analyst MeetingFY28 首次指引 — 原訂 2027-02/03,提前在財務分析師會議以初步展望出現 | FY28 revenue guide ≥+25% → deal-#2 ramp confirmed, recalibrate FY28E; <+18% → TP cutFY28 營收指引 ≥+25% → deal #2 放量確認、FY28E 全面校準;<+18% → 目標價下修 | ✓ hit 09-23✓ 命中 09-23 Revenue $7.0–7.3B (+39–45%) and op income $1.7–1.9B (+80–100%) → ramp confirmed. Promised reaction executed: FY28E rebuilt in this update營收 $7.0–7.3B(+39–45%)、營業利益 $1.7–1.9B(+80–100%)→ 放量確認。照約定執行:FY28E 已在本次更新重算 |
| 2026-09-30 | TrendForce 4Q26 memory price outlookTrendForce 4Q26 記憶體價格展望 | NAND wafer QoQ ≤+10% → GM-repair path confirmed; back above +30% → bear weight upNAND wafer 合約價 QoQ ≤+10% → 毛利修復路徑確認;重回 >+30% → 空方加權 | ◆ undetermined 09-30◆ 無法判定 09-30 TrendForce gave no separate wafer figure: overall NAND +15–20% QoQ, wafer pricing "modest". The test is defined on the wafer number, so it cannot be judged; no reaction, GM assumption unchanged這次沒給 wafer 單獨數字:整體 NAND 單季漲 15–20%,wafer 價格「溫和」。門檻是以 wafer 數字定的,無法判定,所以不動作、毛利率假設不動 |
| 2026-10 下旬 late | Hyperscaler Q3 capex guides (Meta et al.)Hyperscaler Q3 財報 capex 指引(Meta 等) | raises → exabyte orders supported; cuts → cadence risk上修 → EB 訂單有上游支撐;下修 → 出貨節奏風險 | ✓ scheduled已排定 |
| ~2026-12-02 | 3QFY27 earnings3QFY27 財報 | product GM ≥66% AND FY27 FCF guide intact → TP-raise review; GM <65% → base case in doubt, view-cut review產品毛利率 ≥66% 且 FY27 FCF 指引維持 → 目標價上修檢討;<65% → 基準情境存疑、觀點下調檢討 | ◆ est. date推測(未公告) |
| ~2027-02/03 | 4QFY27 results: formal FY28 guidance4QFY27 財報:FY28 正式指引 | revenue low end ≥$7.0B and op income ≥$1.7B held → base case intact; cut below that → TP cut營收下緣 ≥$7.0B 且營業利益 ≥$1.7B 守住 → 基準情境完好;低於此 → 目標價下修 | ◆ est.推測 |
| 2027 | A third hyperscaler design win第三家 hyperscaler design win | announcement itself → bull weight up (management: "multiples of the hyperscalers" engaged)公告本身即觸發 → 多方權重上調(管理層:多家 hyperscaler 洽談中) | ◆ speculative推測 |
| New money未持有 | Do not chase $147. Wait for a price at or below $131 (the target ÷ 1.15, where the view returns to Buy) and the evidence: 3QFY27 product GM holding at or above 66%. Price and evidence both; neither alone. Tripwires (65% GM · $600M FCF · +30% RPO) override everything.不要追 $147。等價格跌到 $131 以下(目標價 ÷ 1.15,觀點回到買進的價位),而且證據同時到位:3QFY27 產品毛利率守住 66% 以上。價格與證據兩者都要,缺一不可。絆線(65% 毛利・$600M FCF・+30% RPO)凌駕一切。 |
| If already held已持有 | Hold: the ramp is confirmed and no tripwire has fired. Stop adding above the $151 target. Consider trimming at $168 or higher (the target ÷ 0.90, where the view turns to Avoid) or on any tripwire.續抱:放量已獲確認,沒有任何絆線觸發。高於目標價 $151 就停止加碼。漲到 $168 以上(目標價 ÷ 0.90,觀點轉為迴避)或任一絆線觸發時,考慮減碼。 |
| Entry zone進場區 | $131 or lower to return to Buy; $168 or higher turns the view to Avoid. If any tripwire fires, every action stops regardless of price.$131 以下回到買進;$168 以上觀點轉為迴避。任一絆線觸發,不論價格,所有動作先停。 |
| Why not more aggressive為何不更激進 | The 59% rise since the last update has already paid out most of the upgrade; the FY28 outlook is still preliminary; NAND contract prices are still rising 15–20% in 4Q26; and the weighted value of $145 sits below the price. The asymmetric mistake here is size, not direction.上次更新後漲的 59% 已經把這次上修的好處多半兌現;FY28 展望仍是初步數字;4Q26 NAND 合約價仍在漲 15–20%;而且加權價值 $145 低於現價。這裡不對稱的錯誤是「倉位大小」,不是方向。 |
| Invalidation失效條件 | (1) 3QFY27 product GM <65%, or the FY27 FCF guide cut below $600M. (2) Hyperscaler deferral evidence: RPO growth falling under +30% YoY, or management re-timing the FY28 ramp. Either one → stop, re-underwrite before averaging down.(1) 3QFY27 產品毛利率 <65%,或 FY27 自由現金流指引下修到 $600M 以下。(2) hyperscaler 遞延證據:RPO 年增掉到 +30% 以下,或管理層改口 FY28 放量時程。任一觸發 → 先停手,重新驗證論點後才談攤平。 |
Grouped audit trail. ✓ = verified against the named source at build; ◆ = this analysis's derivation/judgment (inputs verified); the dropped class (named insider trades) is excluded by rule, not oversight. Full working table with per-claim detail: the research file EVERPURE.md.分組審計軌跡。✓=建置時對照具名來源查證;◆=本研究推導/判斷(輸入項已查證);「剔除」類(具名內部人交易)是依規則排除,不是遺漏。逐項完整工作表見研究檔 EVERPURE.md。
| # | Claim主張 | Verdict · source判定 · 來源 |
|---|---|---|
| Price & valuation價格與估值 | ||
| 1 | 收盤 $147.20(2026-10-06;前值 $92.43/09-02) | ✓ IBKR 日K · 10-06 10-07 更新拉取 |
| 2 | 52週 $56.78–149.05(高點=10-06 盤中)· 位置 98% | ✓ IBKR · 10-06 |
| 3 | YTD +119.7%(基期 2025-12-31 收盤 $67.01)· 1 個月 +45.5%(09-08 $101.14 → $147.20) | ✓ IBKR · 10-06+計算 |
| 4 | 市值 ≈$49.0B · 股數 ~333.2M(基本)/345.6M(稀釋) | ✓ TV 10-06 股數+2QFY27 release 計算(TV 報價 $47.94B @ $143.88) |
| 5 | Trailing GAAP PE ≈201×($147.20 ÷ 近四季 GAAP EPS $0.733) | ✓ TV · 10-06 EPS TTM 取自 sources/everpure/tv-quote-2026-10-06.json;前值 128.2×(stockanalysis 08-31) |
| 6 | fwd PER 52.6×(FY27E 本研究 $2.80)/32.2×(FY28E 本研究 $4.57) | ✓ 計算(147.20÷2.80/÷4.57,10-07 隨價刷新);r2 曾更正算式傳播錯誤 |
| 7 | PBR 31.7×(147.20 ÷ BVPS $4.64,2QFY27 期末) | ✓ 計算 2QFY27 資產負債表;BVPS 未動,隨價刷新 10-07 |
| 8 | 2026 年 forward 倍數約 23–48 倍 | ◆ 近似 價格÷當時共識(2.46 pre-Q2/2.78 post);方法已標註 |
| Results & guidance財務實績與指引 | ||
| 9 | 2QFY27:營收 $1,186M +38%・product $687M +54%・sub $499M +20% | ✓ 2QFY27 release(08-26) |
| 10 | 2QFY27:GM 69.9%・product GM 66.2%・sub GM 74.9%(non-GAAP) | ✓ 同上 |
| 11 | 2QFY27:OI $230M/OM 19.4%(GAAP $63M/5.3%)・EPS $0.70(GAAP $0.21) | ✓ 同上 |
| 12 | 2QFY27:ARR $2.13B +20%・RPO $4.09B +44% | ✓ 同上+slides 轉述 |
| 13 | 2QFY27:OCF -$136M・FCF -$238M・capex $101M・買回 $69M | ✓ 同上+法說 |
| 14 | 負 FCF 主因 NAND/元件戰備採購;FY27 FCF 指引 $600-800M | ✓ CFO 法說 |
| 15 | Q3 指引 $1,325-1,335M/OI $265-275M;FY27 $5.03-5.07B/OI $940-960M(自 $4.41-4.51B/$820-860M 上修) | ✓ release |
| 16 | FY27 初始指引 $4.3-4.4B/OI $780-820M(02-25) | ✓ Q4FY26 release PDF |
| 17 | 1QFY27:$1,053M +35%・product $577M +55%・GM 70.1%・OM 15.1%・EPS $0.47・FCF $112M | ✓ release via StorageNewsletter+Zacks |
| 18 | 1QFY27 product GM 65.5%(66.2 環比 -70bp 反推) | ✓ Investing.com slides 報導+計算 |
| 19 | FY26:$3,662.8M +15.6%・product $1,971.7M・sub $1,691.2M | ✓ Q4FY26 release 損益表 |
| 20 | FY26:non-GAAP GM 72.1%・product GM 68.4%・OI $635M/17.3%・GAAP EPS $0.55 | ✓ 同上 reconciliation |
| 21 | FY26:OCF $880M・FCF $616M・現金+證券 $1.55B・買回 $343M・SBC $481.7M | ✓ 同上現金流量表 |
| 22 | Q4FY26:$1,058.9M +20%・non-GAAP EPS $0.69(前年 $0.45)・ARR $1.92B・RPO $3.67B +40% | ✓ 同上+slides |
| 23 | FY25:$3,168M +11.9%・non-GAAP OI $559.4M/17.7%・FCF $526M;FY24:$2,831M +2.8% | ✓ StorageNewsletter FY25+stockanalysis 年表 |
| 24 | 季營收串 $778/861/964/1,059M 與 YoY +12/+13/+16/+20/+35/+38% | ✓ Q4FY26 slides+releases;YoY 本研究計算 |
| 25 | product GM 串 62.9→64.0→68.0→72.9→67.3→65.5→66.2% | ✓ Q4FY26 slides+FY27 揭露 |
| 26 | 「連續第八季加速」 | ✓ CEO 引述 2QFY27 release |
| 27 | FY25/FY26 non-GAAP EPS ≈$1.63/≈$1.96 | ◆ 推導 法及輸入見 EVERPURE.md T1 註 |
| Hyperscaler & technologyHyperscaler 與技術 | ||
| 28 | Deal #2:08-10 簽約/08-11 公告・top-five・軟體+非NAND・客戶自購 NAND | ✓ 公司 PR+Blocks & Files+法說 |
| 29 | Deal #2:FY27 de minimis・FY28 起有意義放量・「數十 EB into CY2028、數倍於今年預期」 | ✓ 2QFY27 法說 |
| 30 | Deal #1 = Meta | ⚠ 業界指認 官方未具名;DCD/Blocks & Files 普遍認定 |
| 31 | Deal #1:FY27 低雙位數 EB、集中下半年 | ✓ 4QFY26 法說(轉述) |
| 32 | Hyperscaler 收入 GM 75-85%、對 product GM 增益 | ✓ 管理層說法(法說轉述) 當指引看待 |
| 33 | DFM 300TB vs 商品 SSD 上限 256TB;更少模組/功耗 | ✓ Blocks & Files 08-11 |
| 34 | SK hynix hyperscale QLC 合作 | ✓ Q4FY26 release |
| 35 | 預留空間(over-provisioning)約 20-28% | ✓ 業界通則 標為典型區間、非本公司揭露 |
| 36 | 改名時序:2026-02-23 公司名/03-05 掛牌名/04-17 代號 P | ✓ 公司 PR+Nasdaq PR+Q4 release |
| NAND cost environmentNAND 成本環境 | ||
| 37 | NAND 合約價 1Q26 +33-38% QoQ・2Q26 +70-75%・1H26 累計逾 +100% | ✓ TrendForce(01-05/03-31/06-16)+Tom's Hardware |
| 38 | 3Q26 NAND +10-15%・wafer 漲幅「明顯放緩」・eSSD 仍緊 | ✓ TrendForce 07-03 |
| 39 | 企業 SSD 短缺、有效擴產要到 2027 底/2028 | ✓ TrendForce 系列稿 |
| 40 | 「Q2 定價行動大致抵銷成本上漲」「目標不是毛利率極大化」 | ✓ 法說引述 |
| Business, customers & competition事業、客戶與競爭 | ||
| 41 | 客戶 14,500+・F500 64%・G2000 42%・NPS 84(稽核) | ✓ Q4FY26 slides |
| 42 | StaaS TCV:Q4FY26 $179M +28% → 2QFY27 $277M +121%(皆為訂單額,非認列營收) | ✗→ corrected更正 r3 更正口徑(初版誤標營收);r5 更新為最新一季讀數 |
| 43 | >$20M 大單 +385%・>$5M +59%(2QFY27)/+80%(4QFY26) | ✓ 法說 |
| 44 | VMware 替代方案 run rate >$100M/年 | ✓ 2QFY27 法說 |
| 45 | 國際占比單季 42% | ✓ 法說(分析師問答) |
| 46 | EDC/Fusion/AI Copilot(MCP)/Azure Native;1touch 收購(r2 更正:已於 2026-05 完成) | ✓ Q4FY26 release+完成公告 |
| 47 | NetApp FY26 $6.93B +5.4%・GAAP EPS $6.35 | ✓ TradingView 10-K 摘要 |
| 48 | NetApp all-flash 軌跡:Q3FY26 $1.0B → Q4FY26 $1.2B → FQ1FY27 $1.3B 創高(+47%)— 已由 #60 接手為最新讀數 | ✓ NetApp PR ×3 |
| 49 | Dell/HPE/Hitachi/VAST 未量化・Everpure 精確份額未引用 | ✓ 誠實留白 缺乾淨免費來源即不引用 |
| Ownership, consensus & judgment籌碼、共識與判斷 | ||
| 50 | 持股結構:機構 ~81-82%・內部人 4-9%(依口徑)・Colgrove ~3%・Vanguard 5.08%(13G) | ⚠ 口徑依來源 r2 降級:WSZ 讀值不穩(8.6→9.4%、Colgrove 2.59→3.17%)且寬口徑含創投基金 — 改列區間 |
| 51 | 共識:20 位・PT 平均 $145.32($80-180;08-31 為 $130.53,同一序列)・FY27 EPS $2.78(08-31 評級分布 13SB/5B/1H/1SS) | ✓ stockanalysis(PT 09-26;EPS/評級 08-31) |
| 52 | FY28 共識成長 ~+26.6% | ⚠ Q2 前口徑 Zacks via Yahoo;財報後修訂未穩定 |
| 53 | 具名內部人交易(人名+金額+日期) | ✗ 剔除 未逐筆查核 Form 4 → 整類不引用 |
| 54 | FY27E/FY28E 估計・TP $151(前次 $117)・情境與權重・觀點 區間(前次 買進) | ◆ 本研究判斷 依據標註於各表 |
| r2 — added or corrected after external review (2026-09-01)r2 — 外部審閱後新增/更正(2026-09-01) | ||
| 55 | DFM 實物照=StorageReview 75TB QLC 世代(裸 NAND 陣列+介面電路散熱片) | ✓ StorageReview 2023-06 目視比對後才註解;世代已標註 |
| 56 | 1touch 收購已完成:2026-05、$125M 現金、併入 Data Intelligence/EDC | ✓ Cleary Gottlieb+MarketScreener(完成公告 05-11);初版誤載「進行中」四個月 — 已全文改正 |
| 57 | NTAP 估值對照:$185.29(08-31)・trailing 29.2×・forward ~20.5×(調整後口徑) | ✗→ corrected更正 初版「12-13×」為未經查證的記憶值 — 對照組倍數屬市場數字,改為建置時即時拉取(stockanalysis)。r4 內洽檢查:trailing 29.18 = 185.29 ÷ GAAP FY26 EPS 6.35 ✓;同站同日另一讀值 20.7/29.5(差 <1%,不影響 ~1.6 倍溢價結論) |
| 58 | 2QFY27 期末權益 $1,540.8M → BVPS $4.64 → PBR(10-07 隨價為 31.7×;09-03 為 20.0×) | ✓ 2QFY27 release 資產負債表 |
| 59 | 2QFY27 StaaS TCV $277M +121%・Evergreen//One FY27 年化 TCV run rate ~$1B | ✓ 2QFY27 prepared remarks/法說(r5 新增) |
| r6 — NetApp FQ1 scoring round (2026-09-03)r6 — NetApp FQ1 打分回合(2026-09-03) | ||
| 60 | NetApp FQ1FY27:營收 $2.025B +30%(14 週;正規化 ≈+26%,扣指引期口徑 ~$65M/週)・all-flash $1.3B +47%(正規化 ≈+41%)・EPS non-GAAP $2.58・FY27 指引 $7.975-8.225B/EPS $9.73-10.03・收盤 $180.77 -1.3%、盤後 ~-8.7% 至 ~$165 → forward 16.7-18.3×(指引中值 $9.88,本研究計算) | ✓ NetApp PR+stocktitan+stockanalysis(09-02/03) |
| r7 — FY28 outlook round (2026-10-07)r7 — FY28 展望回合(2026-10-07) | ||
| 61 | S&P 500 納入:2026-09-21 開盤前生效,取代 The Trade Desk (TTD) | ✓ S&P DJI 新聞稿 09-04 |
| 62 | FY28 初步展望(09-23 財務分析師會議):營收 $7.0–7.3B(+39–45%)・non-GAAP 營業利益 $1.7–1.9B(+80–100%)・公司稱初步、範圍可能收窄・09-24 股價 +18% 創高 | ✓ 247wallst 09-27+Stocktwits 兩源互證 |
| 63 | 09-24 賣方目標價上調:Piper Sandler 133→162・BofA 150→180・Needham 140→150・Wells Fargo 135→145・Evercore 130→145 | ✓ TradingView 新聞檔 sources/everpure/tv-news-2026-10-06.json |
| 64 | TrendForce 4Q26:整體 NAND 合約價 +15–20% QoQ・wafer 價「預期限制整體漲幅為溫和上升」・無 wafer 單獨百分比・企業 SSD 漲幅加速 | ✓ TrendForce 09-30 |
| 65 | Q2FY27 其他收入 $9.0M(去年同期 $45.7M)・上半年 $22.9M(對 $77.4M)・稀釋股 345.6M(去年同期 337.7M) | ✓ Q2FY27 新聞稿 |
| 66 | IBKR 10-06:收盤 $147.20・52 週 $56.78–149.05・YTD +119.7%・09-08 收盤 $101.14 | ✓ IBKR · 10-06 |
| 67 | 賣方 PT 平均 $145.32(20 位・$80–180);FY27 EPS 共識 2.78 不變(TV 2.777);FY28 共識 EPS 未取得(付費牆) | ✓ stockanalysis 頁面更新 09-26+TV 10-06;FY28 欄標「未取得」 |
| 68 | TradingView 當日資料檔:報價、預估、新聞(均標 2026-10-06) | ✓ sources/everpure/ tv-*-2026-10-06 |
One line:一句話: On 09-23 the company published a preliminary FY28 outlook far above our old estimate; we raised our profit estimate and target, but the stock rose 59% in five weeks and now sits at the new target, so the view steps back to Range-bound — the 33× multiple and every tripwire did not change. 9 月 23 日公司提前公布了明年(FY28)的初步展望,遠高於我們原本的估計;我們調高了獲利預估與目標價,但股價五週漲了 59%,已經站在新目標價旁邊,所以觀點退回區間 — 33 倍的本益比,以及所有事先設定的警訊(這份報告稱為絆線),都沒有變。
1 · The key change: the company gave next year's numbers early1 · 關鍵變化:公司提前給了明年的數字
2 · Why the target rises: more profit, not a pricier multiple2 · 目標價為什麼升:是獲利變多,不是估值變貴
3 · Two September conclusions no longer hold3 · 九月的兩個結論不再成立
4 · The memory-price test could not be scored4 · 記憶體價格這一關:無法打分
5 · Context: the stock joined the S&P 5005 · 背景:股票納入標普 500
6 · Data snapshot (10-06 close)6 · 數據快照(10-06 收盤)
7 · What this means if you hold it or do not7 · 持有或沒持有,這代表什麼
8 · Page reorganised, research unchanged8 · 版面整理,研究內容不變
Moved word for word from the page body on 2026-10-07. The body now states only the current judgment.
2026-10-07 從正文原文照錄搬到這裡。正文現在只寫目前的判斷。
✗→ 33× = market's FY27 multiple The September wording, "33× rolls today's market multiple onto FY28; the price already implies delivery with compression", is superseded: the price now sits on our multiple, so the compression scenario is no longer in the price. ✗→ target below the street The September finding that our target sat below the sell-side average is also superseded: $151 now sits above the stockanalysis average of $145.32 (20 analysts; $130.53 on 08-31, same series).
✗→ 33 倍=市場 FY27 倍數 九月的說法是「把市場今天給 FY27 的倍數平移到 FY28;現價已隱含交付但倍數壓縮」,這句已被取代:價格現在就坐在我們的倍數上,壓縮情境不再被價格涵蓋。✗→ 目標價低於賣方 九月「我們的目標價低於賣方平均」的結論同樣被取代:$151 現在高於 stockanalysis 平均 $145.32(20 位分析師;08-31 為 $130.53,同一序列)。
✗→ target below the street The September point that this page's target sat below the sell-side average is superseded: the street average is now $145.32 and our target is $151.
✗→ 目標價低於賣方 九月「這份報告的目標價低於賣方平均」的說法已被取代:賣方平均現為 $145.32,我們的目標價是 $151。
✗→ superseded 10-07✗→ 10-07 已被取代
✗→ superseded 10-07✗→ 10-07 已被取代 September said "33× = today's FY27 market multiple rolled onto FY28, and the price already implies delivery with compression (3.55 times 26 is about 92)". That is no longer true: the price now sits on our multiple, so the compression scenario is out of the price.
✗→ 10-07 已被取代 九月的說法是「33 倍=把市場今天給 FY27 的倍數平移到 FY28,現價已隱含交付但壓縮(3.55 乘以 26 約 92)」。這已不成立:價格現在就坐在我們的倍數上,壓縮情境不再被價格涵蓋。
The old $85–95 zone is retired: the price is up 59% and the target was rebuilt, so that zone no longer matches any rule on this page.
舊的 $85–95 進場區已作廢:價格漲了 59%、目標價也重算了,這個區間不再對應這份報告的任何規則。
One line:一句話: NetApp's great print set off a sector-wide valuation squeeze; per the pre-written rule we dialed down the "taking share" argument — but no red line fired, so the $117 target and the Buy view stand. 對手財報大好、引發板塊殺估值;我們依規調降「搶市佔」論點 — 但沒有觸發任何紅線,目標價 $117 與「買進」維持不變。
1 · The key change: the rival reported, and we adjusted as promised1 · 關鍵變化:對手放榜,我們依約調整論點
2 · The market signal: great news, stock down — the sector is being de-rated2 · 市場訊號:利多不漲,板塊被殺估值
3 · Data snapshot (09-02 close)3 · 數據快照(09-02 收盤)
Moved word for word from the page body on 2026-10-07. The body now states only the current judgment.
2026-10-07 從正文原文照錄搬到這裡。正文現在只寫目前的判斷。
the earlier claim of a ✗→ superseded已被取代 "~7× growth differential" (built on NetApp's FY26 +5.4%) no longer describes the current quarter —
先前✗→ 已被取代「約七倍成長差」的說法(建立在 NetApp FY26 的 +5.4% 上)已不能描述當季 —
✗→ resolved 09-03已結案 09-03
(i) Reading order. The collapsed full-case block now sits directly after the summary (before Numbers), and Variant Perception moved to the front of that block, right after the four-paragraph argument — a first-time reader now meets the story before the model, while the default decision spine (summary → numbers → catalysts → playbook) is unchanged.
(i) 閱讀順序。收合的完整論證區塊移到摘要正後方(數字章之前),變異認知移到該區塊最前、緊接四段論證 — 首次讀者先遇到故事、再遇到模型;預設決策動線(摘要 → 數字 → 催化劑 → 操作框架)不變。
(ii) Freshness and access. The snapshot mix card was stale by two quarters on subscriptions: StaaS TCV updated from Q4FY26's $179M to 2QFY27's $277M (+121%), with Evergreen//One at a ~$1B annualized run rate (claim #59); every mini-stat now carries its period, and a latest-quarter mix line (product 58% in 2QFY27) sits beside the FY26 donut. The real-module photo's generation note (2023 75TB QLC; current largest 300TB, same architecture) moved into the visible caption; the waterfall's deal-#2 step gained a dashed outline so it does not rely on color alone; the catalyst table now states its scoring protocol (hit/miss entries from 09-02); and a short disclaimer line was added under the Buy verdict in the top strip. Model, weights, TP $117 — untouched. ◆
(ii) 新鮮度與可及性。首屏組合卡的訂閱數字舊了兩季:StaaS TCV 自 Q4FY26 的 $179M 更新為 2QFY27 的 $277M(+121%),Evergreen//One 年化 run rate 約 $1B(查證 #59);每個小數字現在都帶期間標示,FY26 甜甜圈旁加註最新一季組合(2QFY27 產品占比 58%)。實物照的世代註記(2023 年 75TB QLC;現行最大 300TB、同架構)移入可見圖說;瀑布圖 deal #2 那段加虛線框、不再只靠顏色區分;催化劑表寫明打分規則(09-02 起逐列 hit/miss);頂部濃縮行的「買進」下方加上一行簡短免責聲明。模型、權重、目標價 $117 — 未動。◆
(a) NetApp all-flash restated quarter-by-quarter ($1.0B in Q3 → record $1.2B in Q4, ≈$4.9B annualized) so it cannot be confused with a full-year figure — this cell is due for replacement after tomorrow's FQ1 print. (b) NTAP multiples kept at 20.5×/29.2× with an arithmetic cross-check added to the ledger (29.18 = 185.29 ÷ GAAP EPS 6.35 ✓); a same-day reading of 20.7×/29.5× differs by <1% and does not move the ~1.6× premium. (c) The playbook now uses one consistent ruler: tranche one is price-only ($85-95), tranche two is evidence-only (wafer ≤+10% OR GM ≥66%), tripwires override both. (d) The FY28 bridge gained its waterfall diagram — the deal-#2 step drawn green as the not-yet-in-consensus piece. Model, weights, TP $117 — untouched. ◆
(a) NetApp all-flash 改為逐季表述(Q3 單季 $1.0B → Q4 單季 $1.2B 創高、年化約 $4.9B),避免與全年數撞車 — 此格明日 FQ1 發布後即應更新。(b) NTAP 倍數維持 20.5×/29.2×,查證表補算術內洽(29.18 = 185.29 ÷ GAAP EPS 6.35 ✓);同日另一讀值 20.7×/29.5× 差 <1%,不影響 ~1.6 倍溢價。(c) 操作框架改為一把尺:第一批只看價格($85–95)、第二批只認證據(wafer ≤+10% 或 GM ≥66%),絆線凌駕所有批次。(d) FY28 橋補上瀑布圖 — deal #2 那段以綠色標示「尚未入共識」。模型、權重、目標價 $117 — 未動。◆
(i) Fixes. StaaS $179M is TCV bookings, not recognized revenue (slide footnote 2; claim #42 marked corrected — the ledger now counts 2 corrections). NetApp comp made exact and honest: forward 20.5× / trailing 29.2× (stockanalysis 08-31, "~" dropped), premium restated as ≈60% (33.4÷20.5≈1.6×), all-flash refreshed from the year-old $3.6B to 3QFY26's $4.2B run rate and Q4's record $1.2B quarter — flash lifts everyone; the share case is the growth gap on the tide. A basis caveat added (non-GAAP FY27 vs blended forward — growth-gap anchor, not precision relative value). The acceleration chart caption now says plainly: six quarters shown are checkable, "eight straight" is the CEO's claim covering two earlier ones.
(i) 修正。StaaS $179M 是 TCV 訂單額、不是認列營收(簡報註 2;查證 #42 標記更正 — 查證表現為 2 筆更正)。NetApp 對照改精確且誠實:forward 20.5×/trailing 29.2×(stockanalysis 08-31,拿掉「約」),溢價改述為約六成(33.4÷20.5≈1.6 倍),all-flash 從過時一年的 $3.6B 更新為 3QFY26 年化 $4.2B、Q4 單季 $1.2B 創高 — 快閃在抬升所有人,份額論證是潮水之上的成長差;並加口徑但書(non-GAAP FY27 vs blended forward — 只作成長差之錨)。加速圖圖說明講:圖上六季可核對、「連八季」是 CEO 口徑、另含更早兩季。
(ii) Sharpened, not changed. The bridge now states the unit math: deal-1 implies ~$35-45M per exabyte, so deal-2's $300M ≈ 7-8 EB-equivalents — a first-year floor, not "tens of exabytes" discounted in; recognition above $400M in FY28 triggers an upgrade review. The FY28 GM 70.3% now shows its mix arithmetic (HS $1.15B×80% + core ×68.1% ≈ 70.3%): accretion diluted by a deliberately conservative core-margin slide — $3.55 leans on scale and expense leverage, not the mix. The elasticity risk became a four-dial overdraft monitor in the Bear section (two dials red = tripwire even with a pretty GM), and the playbook's second tranche got a hard trigger (wafer ≤+10% OR GM ≥66%; both adverse = no add). Weights 25/50/25, EPS $2.80/$3.55, TP $117, Buy — all unchanged. ◆
(ii) 收斂、未改變。橋表補上單位數學:deal-1 隱含每 EB 約 $35-45M,deal-2 的 $300M ≈ 7-8 EB 等值 — 是首年地板、不是把「數十 EB」折現進來;FY28 認列超過 $400M 即觸發上修檢討。FY28 GM 70.3% 補上 mix 驗算(HS $1.15B×80%+核心×68.1%≈70.3%):增益被刻意保守的核心毛利假設稀釋 — $3.55 靠規模與費用槓桿,不靠 mix。彈性風險落地成空方章的四儀表透支監測表(任兩格轉紅即視同絆線,毛利率再好看也一樣),操作框架第二批改為硬觸發(wafer ≤+10% 或 GM ≥66%;兩者皆反則不加)。權重 25/50/25、EPS $2.80/$3.55、TP $117、買進 — 全部未動。◆
(i) Corrections. 1touch: the initial build carried "acquisition pending" — it in fact closed in May 2026 ($125M cash, completion announced 05-11) and is folded into Data Intelligence/EDC; removed from the catalyst table, corrected in Business (claim #56). Forward PER: $92.95 ÷ $2.78 = 33.4×, not the 33.2× the first version propagated (claim #7). NetApp comparison: the first version cited "12-13×" from memory — NetApp actually trades at $185.29 (08-31), ~20.5× forward on the adjusted basis; the honest contrast is a ~63% premium for a ~7× growth differential (claim #57, marked corrected). Ownership was downgraded to a range (~81% institutional / 4-9% insider, definition-dependent) after the single source proved unstable (claim #50 → ⚠).
(i) 勘誤。1touch:初版寫「收購中」— 實際上 2026-05 已完成交割($125M 現金,完成公告 05-11),併入 Data Intelligence/EDC;自催化劑表移除、商業模式章更正(查證 #56)。Forward PER:$92.95 ÷ $2.78 = 33.4×,初版誤植 33.2× 並全文傳播(#7)。NetApp 對照:初版引用記憶中的「12-13×」— 實際 NTAP 現價 $185.29(08-31)、forward 約 20.5×(調整後口徑);誠實的對照是「約六成溢價買七倍成長差」(#57,標記更正)。持股結構因單一來源讀值不穩降級為區間(機構 ~81%/內部人 4-9% 依口徑;#50 → ⚠)。
(ii) Reinforcements. Added the FY28 bridge (core ≈$5.14B + deal-1 ≈$850M + deal-2 ≈$300M → $6.3B, all explicit assumptions) with the deal-#2-slip stress ($3.15-3.25 → $104-107 at 33×); quantified the elasticity stress into the Bear section (H2 capacity at zero → ~$4.9-5.0B, EPS ~$2.6-2.7, with the "good-looking GM + negative capacity" overdraft signature); separated multiple risk from earnings risk in the TP block (compression to 26-28× = $92-99 even on delivery); stated the SBC assumption behind the TP; PBR refreshed to 20.0× on 2QFY27 equity ($1,540.8M, claim #58); moat watch-points now name venues (OCP Summit / FMS / CES). Sharpened the summary with the one-line ruling: commoditization not yet proven, not yet disproven — the 65% tripwire sits on that line.
(ii) 補強。新增 FY28 橋(核心 ≈$5.14B+deal-1 ≈$850M+deal-2 ≈$300M → $6.3B,全部明示假設)與 deal #2 延後壓力測試($3.15-3.25 → 33× 對應 $104-107);彈性風險量化進空方章(H2 容量歸零 → 營收 ~$4.9-5.0B、EPS ~$2.6-2.7,並點出「毛利率虛胖+容量負成長」的透支訊號組合);目標價區塊把倍數風險與盈餘風險分開(即使交付、倍數壓到 26-28× 即 $92-99);寫明 TP 背後的 SBC 假設;PBR 更新至 2QFY27 期末權益口徑 20.0×($1,540.8M,#58);護城河觀察點補上具體場合(OCP Summit/FMS/CES)。摘要補上一句裁決:商品化尚未證實、也未證偽 — 65% 絆線就設在這條線上。
(iii) What did not move: the 25/50/25 weights, FY27E/FY28E EPS $2.80/$3.55, TP $117, the Buy view, and every tripwire. The ledger now counts 58 claims (51 ✓ · 2 ◆ · 3 ⚠ · 1 corrected · 1 dropped). ◆ = judgment/estimate throughout this entry unless marked otherwise.
(iii) 沒動的東西:25/50/25 權重、FY27E/FY28E EPS $2.80/$3.55、目標價 $117、買進觀點、全部絆線。查證表現為 58 項(51 ✓ · 2 ◆ · 3 ⚠ · 1 更正 · 1 剔除)。◆ =本紀錄除另有標註外,皆屬本研究判斷/估計。
First build of this page, five days after the 2QFY27 print (08-26) and three weeks after the second hyperscaler win (08-11). Research view: Buy. Target $117 (6-month horizon, FY28E non-GAAP EPS $3.55 × 33× forward PER), implied +26% vs the $92.95 close (08-31). Every market number pulled live from IBKR at build; 54 claims through the verification gate (49 ✓ · 2 derived ◆ · 1 industry-attributed ⚠ · 1 dropped by rule). No prior model exists — no revision table until one does. First scheduled examinations: NetApp's print (09-02) and TrendForce's 4Q26 outlook (late Sep); the decisive one is the 3QFY27 report (~12-02): product GM ≥66% with the FCF guide intact confirms the base case, below 65% breaks it.
本頁首次建置 — 在 2QFY27 財報(08-26)後五天、第二家 hyperscaler 簽約(08-11)後三週。研究觀點:買進。目標價 $117(6 個月,FY28E non-GAAP EPS $3.55 × 33 倍 forward PER),對 08-31 收盤 $92.95 隱含 +26%。所有市場數字皆於建置時自 IBKR 即時拉取;54 項主張通過查證關卡(49 ✓ · 2 推導 ◆ · 1 業界指認 ⚠ · 1 依規則剔除)。無前版模型 — 在有之前不會出現任何調整前欄位。第一批排定的考試:NetApp 財報(09-02)與 TrendForce 4Q26 展望(9 月下旬);決定性的一場是 3QFY27 財報(約 12-02):產品毛利率 ≥66% 且 FCF 指引未動=基準情境確認;跌破 65%=基準情境破功。
| Date日期 | Action動作 | View觀點 | TP | Close收盤 |
|---|---|---|---|---|
| 2026-09-01 | Initial coverage初次評估 | Buy買進 | 117 | 92.95 |
| 2026-09-01 r2 | External-review corrections (1touch closed · 33.4× · NTAP comp · ownership range) + FY28 bridge and stress tests外部審閱勘誤(1touch 已交割・33.4×・NTAP 對照・持股區間)+FY28 橋與壓力測試 | Buy (unch.)買進(維持) | 117 | 92.95 |
| 2026-09-01 r3 | Second review pass: StaaS=TCV fix · NTAP comp exact · bridge unit math · GM mix check · overdraft monitor · hard tranche trigger第二輪審閱:StaaS=TCV 修正・NTAP 對照精確化・橋表單位數學・GM mix 驗算・透支監測表・第二批硬觸發 | Buy (unch.)買進(維持) | 117 | 92.95 |
| 2026-09-01 r4 | Final polish: all-flash wording · NTAP cross-check · one-ruler playbook定稿潤飾:all-flash 措辭・NTAP 內洽檢查・操作框架一把尺 | Buy (unch.)買進(維持) | 117 | 92.95 |
| 2026-09-01 r5 | Public-page polish: story before model · snapshot to 2QFY27 · photo generation note · a11y公開版打磨:故事前置・首屏 2QFY27 化・照片世代註記・可及性 | Buy (unch.)買進(維持) | 117 | 92.95 |
| 2026-09-03 | Catalyst #1 scored (NetApp: industry-wide boom confirmed → share argument dialed down, as pre-committed) · sector-wide valuation squeeze logged as yellow light · numbers refreshed催化劑 #1 打分(NetApp:證實產業整體大漲 → 依約調弱「搶份額」論點)· 板塊殺估值列入黃燈 · 數字刷新 | Buy (unch.)買進(維持) | 117 | 92.43 |
| 2026-10-07 | FY28 outlook (09-23) scored: ramp confirmed, FY28E rebuilt (EPS 3.55 → 4.57), TP raised on EPS not multiple · TrendForce row undetermined · view steps back as price reaches target · old $85-95 zone retiredFY28 展望(09-23)打分:放量確認、FY28E 重算(EPS 3.55 → 4.57)、目標價因 EPS 而非倍數上修 · TrendForce 列無法判定 · 價格到達目標價,觀點退回 · 舊 $85-95 進場區作廢 | Buy → Range-bound買進 → 區間 | 117 → 151 | 92.43 (09-02) → 147.20 (10-06) |
Append-only ledger; entries are never deleted, only restated on the record.附加式(append-only)紀錄;條目永不刪除,只在紀錄上更正。