$215.83
Close, Oct 7 (US)收盤(10-07,美股)
Suggested path: summary, four-line chain block, numbers, what to watch, playbook (about 8 minutes). The full case is folded; tap it to open.預設動線:摘要、卡點四行、數字、觀察時間點、操作框架,約 8 分鐘;完整論證已收合,點開才會展開。
Arista sells the network switches (machines that forward data) that tie thousands of chips together inside AI data centers. It is not an AI chip company. The business is strong, but at $216 the stock is already 52 times this year's expected profit, so this analysis would not buy now; 12-month target price $191.Arista 賣的是網路交換器,也就是 AI 機房裡負責轉送資料的「網路交通號誌」,把成千上萬顆晶片接在一起。它不是 AI 晶片公司。生意很好,但股價 216 美元,已是今年預估獲利的 52 倍(本益比,獲利不變的話約要等這麼多年才回本),所以本研究現在不買,一年目標價(一年後的合理股價)是 191 美元。
一句話:這是第一次評估。股價從 7 月 24 日的 174 美元漲到 216 美元。本研究的觀點是「迴避」,意思是現在不買。
One line: this is the first assessment. The stock rose from $174 on July 24 to $216. Our view is "avoid", meaning do not buy now.
Case probabilities are this analysis's judgment, not a measured figure.三種情況的機率是本研究的判斷,不是量測數字。
If you hold it: hold, no add; if the price passes $240 and the November report does not make us raise our estimates, trim one third. New money: do not buy now; wait for the price to return to $146-166 and for the latest report to show an adjusted gross margin of at least 63.5% with the full-year outlook raised again.
已持有:續抱,不加碼。漲到 240 美元以上、11 月財報又沒有讓本研究上修估計(調高獲利預測),就減碼(賣出)三分之一。新資金:現在不買。等價格回到 146 到 166 美元(進場區,可以開始買的價格範圍),而且最近一次財報的調整後毛利率(每賣一塊錢,扣掉直接成本還剩幾毛)不低於 63.5%、全年營收預期又調高了,才進場。
Personal research, not investment advice個人研究,非投資建議
1. The business is strong. Chips inside an AI data center must pass data to each other, and Arista sells the switches that route it. Second-quarter revenue was $3.04B, up 37.7% from a year earlier, and the full-year outlook was raised three times in 2026 to about $12.6B.
1. 生意很好。AI 機房裡的晶片要互相傳資料,Arista 賣的是轉送資料的交換器,客戶是雲端大廠。第二季營收 30.4 億美元,比一年前多 37.7%;公司預告的全年營收(財測)在 2026 年內調高三次,現在約 126 億美元。
2. The price is high and profit is leaking. At $215.83 the stock is 52 times this year's expected profit and 41.5 times next year's consensus profit, at or above the top of Arista's own history. Second-quarter adjusted gross margin (excluding stock pay and similar items) fell from 65.6% to 63.4% because large customers get bigger discounts.
2. 價格很貴,利潤在流走。股價 215.83 美元,是今年預估獲利的 52 倍、明年共識獲利的 41.5 倍,已經在 Arista 自己歷史倍數的最上緣或以上。第二季調整後毛利率(排除股票薪酬等項目)從 65.6% 降到 63.4%,因為大客戶拿的折扣較多。
Research view: avoid, meaning we expect a fall of more than 10% over six months. Target price: $191 in 12 months, 11.5% below the $215.83 close. That is only 1.5 points past the "avoid" edge. The boundary price is $212 (1.7% below the close); from here on, if only the price moves, the view changes only after a move of 3 more points or 5 consecutive trading days. The label sits on the edge and depends on the measure. On the stricter measure (same-year multiples) the target is about 11.5% below the price. On the multiples the market actually paid on expected profit (23.5 to 46.9 times over the past four years, 41.5 to 46.4 today, inside the top of the range), fair value is about the current price and the label would be "range-bound". This analysis uses the stricter measure, so it says "avoid"; $191 is a price that measure produces, not one the evidence locks in.
研究觀點:迴避,意思是預期未來半年股價下跌超過 10%。目標價:12 個月 191 美元,比收盤 215.83 美元低 11.5%,只比「迴避」的邊界多 1.5 個百分點。分界價是 212 美元(比收盤低 1.7%);往後若只有股價在動,要超過邊界 3 個百分點或連續 5 個交易日,才改變觀點。這個標籤貼在邊界上。用較嚴的算法(當年倍數),目標價比現價低約 11.5%。若改用市場當時實際付的預估倍數(過去四年 23.5 到 46.9 倍,現在 41.5 到 46.4 倍,在上緣之內),合理價約等於現價,標籤會是「區間」。本研究採用較嚴的算法,所以寫「迴避」;191 美元是這個算法算出的價格,不是證據鎖定的價格。
Risk factors: AI orders staying strong longer, supply easing early so revenue beats our estimate, and a third large customer joining. All three lift the price, so "avoid" does not mean selling short.
風險因子:AI 訂單比預期更久不降溫、供應提早鬆開讓營收超出估計、第三個大客戶加入。三者都會推高股價,所以「迴避」不等於放空。
一句話:Arista 不是卡點(少了它整條供應鏈就會停擺的關鍵一環)。生意是真的,但新增利潤有一部分流走,而且股價的倍數已在自己歷史的最上緣,高出平均的部分在為新角色先付錢。
One line: Arista is not a choke point. The business is real, but part of the new profit leaks away, and the price multiple already sits at the top of its own history, with the part above the average paying for a bigger role.
1. Role: not an AI chip company, and not NVIDIA, which bundles chips with the network. It is the Ethernet switch supplier (Ethernet is the open standard ordinary networks use) that links the AI chips in a cloud giant's data center into one machine. 42% of revenue comes from two customers, which the CEO named as Microsoft and Meta, so it bets on their data-center budgets, not on the whole AI buildout.
1. 角色:不是 AI 晶片公司,也不是把晶片和網路綁在一起賣的輝達。它是替雲端大廠把機房裡的 AI 晶片接成一台機器的交換器供應商。營收 42% 來自兩家客戶,執行長說是微軟和 Meta,所以它押的是這幾家的機房預算,不是整個 AI 建設潮。
2. Choke type: not a choke point. Customers have substitutes: NVIDIA's own switches were already first in the data-center category in the second quarter of 2026 (20.4% share against Arista's 18.7%), and Dell'Oro ranks AI data-center networking Celestica, NVIDIA, Arista (Dell'Oro notes that counting Arista's deferred AI revenue would narrow the gap considerably). The shortage is Arista's own, not an industry that cannot do without Arista. The company gives no per-customer qualification times, so the "qualification choke" label is not given.
2. 是不是卡點:不是。客戶有替代品:輝達自己的交換器在 2026 年第二季已是資料中心類第一(市占 20.4%,Arista 18.7%),Dell'Oro 的 AI 機房排名是 Celestica、輝達、Arista(Dell'Oro 註明,把 Arista 已收款、還沒入帳的 AI 營收算進去,差距會小很多)。缺貨的是 Arista 自己,不是全產業缺 Arista。公司也沒公布各客戶完成認證要多久,所以不給「認證卡點」標籤。
3. Does the profit stay? The gross-margin line is leaking. Second-quarter revenue grew 37.7%, yet adjusted gross margin (excluding stock pay and similar items) fell from 65.6% to 63.4%; the 10-Q blames a higher share of large customers with bigger discounts. Adjusted operating margin still rose to 49.9% (48.8% a year earlier) because costs are spread thinner. Stock pay grew 35% in the first half against revenue growth of 36%.
3. 利潤守不守得住:毛利這一行在漏。第二季營收年增 37.7%,調整後毛利率(排除股票薪酬等項目)卻從 65.6% 降到 63.4%;季報(10-Q)說原因是大客戶比重升高、折扣較多。調整後營業利益率(排除股票薪酬等項目後,每賣一塊錢扣掉營運費用剩幾毛)仍升到 49.9%(一年前 48.8%),因為費用攤得更薄。股票薪酬(用公司股票發的薪水)增速 35%,和營收的 36% 相當。
4. Already priced in: both, and the multiple is at the top of its own history. At each year-end from 2022 to 2025 the market paid 23.5 to 46.9 times next year's expected profit (stockanalysis), about 36 on average; today it is 41.5. Up to the average the price pays for profit growth; the extra 5 or so turns pay for the new role (links between buildings, links inside a rack, an AI lab as a third large customer). On stricter measures (see "More numbers") today is far above its history. So this is not a "buy".
4. 已經反映在股價裡:兩者都有,倍數已在自己歷史的最上緣。2022 到 2025 年每年年底,市場為「明年預估獲利」付 23.5 到 46.9 倍(stockanalysis 網站),平均約 36 倍;現在是 41.5 倍。到平均為止付的是獲利成長;高出的約 5 倍付的是新角色(連接好幾座機房、連接機櫃內的晶片、AI 公司成為第三個大客戶)。較嚴格的算法(見「更多數字」)下,現在遠高於歷史。所以這不是「買進」。
Our 2027 EPS of $5.03 is 3% below the $5.20 sell-side consensus (2026: $4.14 against $4.11). The real difference is the multiple: the sell-side target implies 46.5 times, we use 38.
本研究估的 2027 年每股獲利 5.03 美元,比賣方(券商分析師)共識(他們的平均預估)5.20 美元低 3%(2026 年 4.14 對 4.11 美元)。真正的差別在倍數:賣方目標價隱含 46.5 倍,本研究用 38 倍。
| $B十億美元 | FY2025A2025 年(實際) | FY2026E2026 年(估) | FY2027E2027 年(估) |
|---|---|---|---|
| Revenue營收 | 9.01 | 12.76 | 16.0 |
| Adjusted EPS ($)調整後每股獲利(美元) | 2.98 | 4.14 | 5.03 |
The target price is $191. We estimate 2026 and 2027 adjusted EPS (earnings per share) at $4.14 and $5.03, and set the target on 2027 EPS times a 38x P/E (how many times per-share profit the stock price equals). 38 is the top of Arista's 25 to 39 times range for the completed years 2023 to 2025 (year-average price divided by that year's profit). This multiple pays for profit growth and nothing for a bigger role. The target covers 12 months.
目標價 191 美元。本研究預估 2026、2027 年調整後每股獲利(EPS,排除股票薪酬和併購攤銷)為 4.14、5.03 美元,目標價是 2027 年每股獲利乘以 38 倍本益比(股價是每股獲利的幾倍)。38 倍是 Arista 完整年度(2023 到 2025 年)「當年平均股價除以當年獲利」區間 25 到 39 倍的上緣。這個倍數付的是獲利成長,沒有為角色改變多付錢。目標價期限 12 個月。
How the prices reconcile: $191 is the base case (2027 EPS of $5.03 times 38) and the formal target; it also equals 32.2 times 2028 EPS of $5.94, between the historical 28.3 times ($168) and 36.2 times ($215); the three cases weighted give $190. 2028 profit cannot simply be multiplied by 38: 38 is a multiple of same-year profit, and multiplying would count a year of growth twice.
三個價位怎麼對上:191 美元是基準情境(2027 年 5.03 美元乘 38 倍),是正式目標價;它等於對 2028 年獲利 5.94 美元的 32.2 倍,介於歷史上的 28.3 倍(168 美元)和 36.2 倍(215 美元)之間;三種情況加權是 190 美元。不能把 38 倍直接乘 2028 年獲利:38 倍是「當年獲利」的倍數,直接乘會把一年的成長算兩次。
The 31 sell-side analysts' average target is $241.93 (stockanalysis, October 7; low $190, high $289). Assuming their 2028 profit is close to our 30%-growth case of $6.36 (the consensus is paywalled), that is 38.0 times; our $191 is 32.2 times. The $51 gap is about one quarter earnings path and three quarters multiple: the sell-side carries the roughly 40 times average of year-ends 2023 to 2025 onto 2028 profit, and we do not, because profit growth slows from +39% in 2026 to +18% in 2028.
31 位賣方分析師的平均目標價是 241.93 美元(stockanalysis,10 月 7 日;最低 190、最高 289)。假設他們的 2028 年獲利接近本研究 30% 成長情境的 6.36 美元(共識要付費才看得到),這是 38.0 倍;本研究的 191 美元是 32.2 倍。差距 51 美元,約四分之一是獲利路徑,約四分之三是倍數:賣方把 2023 到 2025 年年底的平均約 40 倍搬到 2028 年,本研究不照搬,因為獲利成長從 2026 年的 +39% 降到 2028 年的 +18%。
The same stock gives different answers depending on how the multiple is measured. The table lists Arista's P/E by year in four ways; the right column is today.
同一檔股票,倍數怎麼算,結論就不一樣。下表用四種算法列出 Arista 歷年的本益比(股價是每股獲利的幾倍),最右欄是現在。
| Basis算法 | 2022 | 2023 | 2024 | 2025 | Today現在 |
|---|---|---|---|---|---|
| A | 26.0 | 25.4 | 36.4 | 38.6 | 52.1 |
| B | 17.2 | 19.0 | 28.3 | — | 42.9 |
| C | 26.5 | 34.0 | 47.6 | 44.0 | 52.1 |
| D | 23.5 | 33.6 | 46.9 | 40.9 | 41.5/46.4 |
How to read it: the first two rows use year-average prices, which sit below year-end prices in years the stock rose, so they understate the multiples; the second row also uses actual profit known only afterwards, and actual profit often beat expectations. They are the strictest measures, and today is outside the range (13.5 turns above the top in row one, 14.6 in row two). Row three is closer to comparing with today's spot price, and today is only 4.5 turns above its top. Row four is what the market actually paid on expectations, and today is at the top of that range, not beyond it. Overall: Arista's multiple is at the top of its own history; far above it on strict measures, merely touching the top on loose ones.
怎麼讀:前兩列用「年平均股價」,股價一路漲的年份,平均價低於年底價,倍數會被壓低;第二列又用事後才知道的實際獲利,而實際獲利常常比事前預期高。所以前兩列是最嚴格的比法,現在落在區間之外(第一列高出上緣 13.5 倍,第二列高出 14.6 倍)。第三列比較接近「用現價來比」的情況,現在只高出上緣 4.5 倍。第四列是市場當時真正付的預估倍數,現在在區間上緣,沒有高出去。整體讀法:Arista 現在的倍數在自己歷史的最上緣;嚴格比法下遠高於歷史,寬鬆比法下只是貼著上緣。
Twelve months from now (October 2027) the market will look at 2028 profit. Our 2028 estimate: revenue up 18% to $18.88B, operating margin held at 48%, other income $0.70B, tax rate 21.5%, 1.29B diluted shares, adjusted EPS $5.94 (18% above 2027). The 18% growth for 2028 is this research's assumption, not derived from the supply timeline. The supply squeeze is used only to explain why 2027 growth should not exceed about 30%; if supply eases early, 2028 shipments could grow faster than 18%, which is an upside risk.
12 個月後(2027 年 10 月),市場看的會是 2028 年的獲利。本研究的 2028 年估計:營收增加 18%,到 188.8 億美元;營業利益率維持 48%;其他收入 7 億美元;稅率 21.5%;稀釋股數 12.9 億;調整後每股獲利 5.94 美元(比 2027 年多 18%)。2028 年 18% 的成長是本研究的假設,不是從供應時間表推出來的。供應吃緊只用來說明 2027 年成長為什麼不會超過 30% 左右;供應提早鬆開,2028 年出貨也可能成長得比 18% 快,這是上行風險。
The same $191 equals 32.2 times 2028 profit. Profit for "next year" must be compared with the "next-year" historical multiples (rows two and four above): the 28.3 times top of row two on $5.94 is $168, and the 36.2 times four-year average of row four is $215. $191 sits between them, on the low side.
同一個 191 美元,換成對 2028 年獲利的算法是 32.2 倍。對「下一年」獲利,要拿「下一年版」的歷史倍數來比(上表第二、四列):第二列上緣 28.3 倍乘 5.94 美元是 168 美元;第四列四年平均 36.2 倍乘 5.94 美元是 215 美元。191 美元在兩者之間,偏低一些。
Why the formal target stays on the 2027 basis: first, 2027 has a sell-side consensus ($5.20) to check against and 2028 does not; second, row two is the strictest hindsight measure, and using it as the formal target would assume the market always underestimates profit; third, growth slows from +39% in 2026 to +21.5% in 2027 and +18% in 2028, so the average multiple of the fastest-growing years should not be used. Result: "avoid" holds at $168 (22% below) and at $191 (11.5% below); only at $215 (flat) does it become directionless.
為什麼正式目標價仍用 2027 年的算法:第一,2027 年有賣方共識(5.20 美元)可以對照,2028 年沒有;第二,第二列是事後算出的最嚴格比法,拿它當正式目標價,等於假設市場永遠低估獲利;第三,成長從 2026 年的 +39% 放慢到 2027 年的 +21.5%、2028 年的 +18%,所以不該拿成長最快那幾年的平均倍數。結論:「迴避」在 168 美元(低 22%)和 191 美元(低 11.5%)都成立;用 215 美元(持平)才變成沒有方向。
The table varies two things: 2027 revenue growth of 20%, 25% and 30% (2028 growth of 15%, 18% and 22% in brackets) and the multiple of 34, 38, 42 and 46 times (same-year basis). Each cell is a price, with the equivalent multiple of 2028 profit in brackets.
下表改變兩件事:2027 年營收成長 20%、25%、30%(括號內是 2028 年成長 15%、18%、22%),以及本益比 34、38、42、46 倍(同年算法)。每格是價格,括號內是換成對 2028 年獲利的倍數。
| Growth (2028)成長(2028 年成長) | 34 倍 | 38 倍 | 42 倍 | 46 倍 |
|---|---|---|---|---|
| 20% (15%) EPS 4.84 / 5.5920%(15%) 每股獲利 4.84/5.59 | 165(29.5) | 184(32.9) | 203(36.4) | 223(39.9) |
| 25% (18%) base EPS 5.03 / 5.9425%(18%)基準 每股獲利 5.03/5.94 | 171(28.8) | 191(32.2) | 211(35.5) | 231(38.9) |
| 30% (22%) EPS 5.22 / 6.3630%(22%) 每股獲利 5.22/6.36 | 177(27.9) | 198(31.2) | 219(34.5) | 240(37.7) |
Forward basis (price = 2028 EPS times 28, 32, 36 and 40): growth of 20% gives $156, $179, $201 and $223; 25% gives $166, $190, $214 and $238; 30% gives $178, $203, $229 and $254.
遠期算法(價格=2028 年每股獲利乘以 28、32、36、40 倍):成長 20% 是 156、179、201、223 美元;成長 25% 是 166、190、214、238 美元;成長 30% 是 178、203、229、254 美元。
Reading the first table (12 cells): 5 cells are more than 10% below the price (avoid), 7 are between 10% below and 15% above (range-bound), none reaches 15% above (buy), and the best is $240 (11% above). For a 15% gain the price must reach $248.2, which is 49.3 times 2027 profit of $5.03, higher than any year-end in Arista's history (highest 47.6 times).
怎麼讀第一張表(12 格):5 格比現價低 10% 以上(迴避),7 格在低 10% 到高 15% 之間(區間),沒有任何一格達到高 15%(買進),最好的一格是 240 美元(高 11%)。要讓買進有 15% 的空間,價格得漲到 248.2 美元,等於 2027 年獲利 5.03 美元的 49.3 倍,比 Arista 歷史上任何一個年底(最高 47.6 倍)都高。
Conclusion: the evidence supports 25% to 30% (the upper half of the range) and not 20%. We set the base at 25%, the lower edge of that range, because everything beyond two quarters of visibility is assumption. The difference between 25% and 30% is $191 against $198; at 30% growth the target is 8% below the price and the view reads "range-bound".
結論:證據支持 25% 到 30%(範圍的上半部),不支持 20%。本研究把基準放在 25%,是這個範圍的下緣,因為兩季能見度以外都是假設。25% 和 30% 的差別,就是 191 美元對 198 美元;成長 30% 時目標價低 8%,觀點會變成「區間」。
An adjusted gross margin of 63% is about today's run rate: 63.4% in the second quarter, about 63% guided for the third and a full-year guide of 62% to 64%. So 63% only proves it stopped sliding, not that profit is repaired. The 63.4% also includes a tariff refund (the CFO said about 0.2 to 0.3 points; refunds do not usually repeat every quarter), leaving about 63.1% to 63.2%. 63.5% is about 0.3 points above that, the first sign of repair. One quarter is still not repair; it takes two, so a "buy" label separately requires two quarters (chain line 3). The entry rule also requires the full-year outlook to be raised again, to avoid mistaking a price fall caused by weaker demand for a bargain.
調整後毛利率 63% 差不多就是現在的水準:第二季是 63.4%,第三季公司預告約 63%,全年預告區間是 62% 到 64%。所以 63% 只能證明沒有再往下掉,不能證明利潤已經修復。第二季的 63.4% 還含有關稅退款(財務長說約 0.2 到 0.3 個百分點;退款通常不會每季重複),扣掉後約 63.1% 到 63.2%。63.5% 比這個水準高約 0.3 個百分點,才開始像在修復。一季達標仍不算修復,要連兩季,所以「買進」標籤另外要求連兩季(見卡點四行第三行)。進場條件另加「全年營收預期又調高」,是為了避開股價下跌其實是需求變差的情況。
Next year's P/E of 42.9 divided by our expected EPS growth of 21.5% is about 2.0; on the sell-side consensus, 41.5 divided by 26.5% is about 1.6; on revenue growth of 25.3% it is about 1.7. The higher the ratio, the more is paid for each point of growth; there is no standard answer and it only compares with other companies or its own past.
明年(2027 年)本益比 42.9 倍,除以本研究估計的每股獲利成長 21.5%,約 2.0;用賣方共識,41.5 倍除以 26.5%,約 1.6;改用營收成長 25.3%,約 1.7。這個比值越高,每一點成長付的價錢越貴;它沒有標準答案,只能和別的公司或自己的過去比。
No peer is a clean comparison: Cisco (forward P/E 22.9) grew revenue 18% (fiscal fourth quarter 2026, secondary source) but mixes campus networking, security and software; Celestica is an assembler with a segment margin of only 8.7% (secondary source) against Arista's adjusted operating margin of 49.9%; NVIDIA is a different scale, with a $5.78T market cap and a 75.0% gross margin (secondary source); Broadcom is Arista's chip supplier. So Arista should trade above these peers, but these numbers cannot say by how much.
同業都不是好比較對象:思科(預估本益比 22.9 倍)的營收增加 18%(2026 財年第四季,二手來源),但業務混著校園網路、安全和軟體;Celestica 是組裝代工,部門利潤率只有 8.7%(二手來源),Arista 調整後營業利益率是 49.9%;輝達規模是另一個等級,市值 5.78 兆美元、毛利率 75.0%(二手來源);博通是 Arista 的晶片供應商。所以 Arista 本來就該比這些同業貴,但貴多少,這些數字回答不了。
The 25/50/25 probabilities are symmetric judgment; we have no evidence to tilt them either way, so the weighted $189.75 only checks that the base case is not dragged off by the tails and is not independent proof; the call rests on the base case. With 30% bear and 20% bull the weighted value is $182; the other way round it is $197.三種情況的機率 25/50/25 是對稱的主觀判斷,本研究沒有證據支持偏向哪一邊,所以加權後的 189.75 美元只是檢查基準情境有沒有被極端情況拉偏,不是獨立的證明;判斷靠的是基準情境。權重改成悲觀 30%、樂觀 20%,加權是 182 美元;反過來是 197 美元。
Fiscal year equals calendar year. EPS is adjusted (excluding stock pay and acquisition amortization). The 2026 estimate is the first-half actual of $1.89 plus our third- and fourth-quarter estimates (revenue $3.40B and $3.62B, 3% above the company's $3.3B third-quarter guide, because the past two quarters beat guidance by 4% and 8%). The 2027 estimate assumes revenue up 25%, adjusted gross margin about 62.5%, operating margin 48%, tax rate 21.5% and 1.285B diluted shares. Consensus is from Yahoo Finance, 2026-10-06, 29 analysts.
財年等於日曆年,也就是每年一月到十二月。每股獲利用的是調整後數字,先排除股票薪酬和併購攤銷。2026 年的估計等於上半年實績 1.89 美元,加上第三、第四季的本研究估計。這兩季的營收估計是 34.0 億、36.2 億美元,比公司對第三季的預告 33 億高 3%,因為過去兩季各超出預告 4% 與 8%。2027 年估計有五個依據:營收增加 25%、調整後毛利率約 62.5%、營業利益率 48%、稅率 21.5%,以及稀釋股數 12.85 億(把可能新增的股票也算進去的總股數)。共識來自 Yahoo Finance,日期是 2026-10-06,共 29 位分析師。
How the P/E range is measured: the year's average of IBKR month-end closes divided by that year's adjusted EPS, completed years only (2022: 26.0, 2023: 25.4, 2024: 36.4, 2025: 38.6). The "ten-year median" on finance sites uses trailing four-quarter standard-accounting profit, so the basis differs and the two cannot be compared directly. This year's 52.1 is shown only for reference and is not part of the range.
本益比區間是這樣算的:先用 IBKR 的每月收盤價,算出當年的平均股價,再除以當年的調整後每股獲利。只用已經結束的年度:2022 年 26.0、2023 年 25.4、2024 年 36.4、2025 年 38.6。財經網站常見的「十年中位數」,是用一般會計準則算的過去四季獲利,口徑不同,不能直接比。今年(2026 年)的 52.1 倍只當參考,不放進區間。
| Reading項目 | Value數值 |
|---|---|
| Gross margin: 62.9% on standard accounting (Q2); adding back stock pay of $7.4M and acquisition amortization of $7.0M gives 63.4% adjusted (gross profit $1,910.3M plus $14.4M equals $1,924.7M)毛利率:一般會計 62.9%(第二季);加回股票薪酬 740 萬美元和併購攤銷 700 萬美元後,調整後 63.4%(毛利 19.103 億美元加 1,440 萬美元,等於 19.247 億美元) | 62.9%/63.4% |
| Price needed for a 15% gain (215.83 times 1.15), and that as a multiple of 2027 profit of $5.03價格要漲 15% 才算有「買進」空間(215.83 乘 1.15);等於 2027 年獲利 5.03 美元的幾倍 | $248.2/49.3 倍 |
| Year-end prices (December closes, IBKR monthly bars): 2022 / 2023 / 2024 / 2025年底股價(IBKR 月 K 的 12 月收盤):2022/2023/2024/2025 | $30.34/$58.88/$110.53/$131.03 |
| Close, Oct 7 (IBKR daily bar)收盤價(10-07,IBKR 每日股價資料) | $215.83 |
| 52-week low to high (intraday, IBKR daily bars)過去一年的最低價到最高價(盤中,IBKR 每日股價資料) | $114.52(2025-11-20)到 $217.32(2026-10-07) |
| Market cap (close times 1,260.1M basic shares)市值(收盤價乘以 12.601 億股的基本股數;市值就是整家公司股票的總價) | 約 $272B |
| P/E, standard accounting, last four quarters (EPS $3.16)本益比:一般會計準則、過去四季(獲利 3.16 美元) | 68.3 倍 |
| P/E, adjusted, last four quarters (EPS $3.47)本益比:調整後、過去四季(獲利 3.47 美元) | 62.2 倍 |
| P/E this year / next year on sell-side consensus ($4.11 / $5.20)本益比:今年/明年,用賣方共識(4.11/5.20 美元) | 52.5 倍/41.5 倍 |
| P/E this year / next year on our estimates ($4.14 / $5.03)本益比:今年/明年,用本研究估計(4.14/5.03 美元) | 52.1 倍/42.9 倍 |
| Peers' forward P/E (stockanalysis, Oct 7): Cisco / NVIDIA / Celestica / Broadcom同業的預估本益比(stockanalysis 網站,10-07):思科/輝達/Celestica/博通 | 22.9/19.8/25.0/21.7 倍;Arista 46.4 倍 |
| Peers' trailing P/E: Cisco / NVIDIA / Celestica / Broadcom同業過去四季本益比:思科/輝達/Celestica/博通 | 35.4/30.3/40.0/48.0 倍 |
| Cash plus marketable securities (June 30, 2026)現金加有價證券(可以很快換成現金的投資,2026-06-30) | $13.34B |
| Purchase commitments (non-cancellable component orders, June 30, 2026; about $3.6B a year earlier)採購承諾(已簽約、不能取消的零件訂單,2026-06-30;一年前約 36 億) | $9.7B(9.4B 在 12 個月內到貨) |
| Deferred revenue (cash collected, revenue not yet booked, June 30, 2026; $5.37B at end-2025)遞延收入(客戶已經付款、公司還沒算進營收的錢,2026-06-30;2025 年底 53.7 億) | $6.87B |
| Inventory (June 30, 2026; $2.25B at end-2025)存貨(2026-06-30;2025 年底 22.5 億) | $2.54B |
| Price at which the view becomes "range-bound" (target divided by 0.90)觀點會從「迴避」變成「區間」的價位(區間是指股價在一個範圍內來回、沒有明顯方向;目標價除以 0.90) | $212.2 |
| Price at which the view would become "buy" (target divided by 1.15)觀點會變成「買進」的價位(目標價除以 1.15) | $166.1 |
Market cap and P/E use the IBKR close; peer figures come from stockanalysis dated 2026-10-07 and may be intraday prices. Adjusted profit is 7% above standard-accounting profit (second quarter $1.02 against $0.95), mostly stock pay ($120.4M in the second quarter), well under 2x, so no extra bridge is needed.
市值和本益比用 IBKR 的收盤價算出。同業數字來自 stockanalysis 網站,日期是 2026-10-07,價格可能是盤中價。調整後獲利比一般會計獲利高 7%(第二季 1.02 對 0.95 美元)。差距主要是股票薪酬(第二季 1.204 億美元)。差距遠不到兩倍,所以不必另外列出調整項目。
Two checkpoints are open below, each with a "see this, do this" rule written in advance. The rest sit in the fold.
下面先列兩個時間點,每一個都事先寫好「看到什麼,就做什麼」。其餘收在摺疊裡。
If it hits:達標: Revenue of $3.40B or more, adjusted gross margin of 63.5% or more, and a full-year outlook of $13.2B or more: raise 2027 EPS to $5.33, the target to about $203 and the top of the entry zone to $176.營收 34.0 億美元以上、調整後毛利率 63.5% 以上,且全年營收預期調到 132 億美元以上,就把 2027 年每股獲利上修到 5.33 美元,目標價升到約 203 美元,進場區上緣升到 176 美元。
If it misses:落空: Adjusted gross margin below 62.5%, or no raise to the full-year outlook: cut 2027 EPS to $4.71, the target to about $179 and the top of the entry zone to $156.調整後毛利率低於 62.5%,或全年營收預期沒有調高,就把 2027 年每股獲利下修到 4.71 美元,目標價降到約 179 美元,進場區上緣降到 156 美元。
If it hits:達標: A third 10% customer appears and the top two total 40% or less (42% in 2025): bull-case probability to 30%, probability-weighted value to about $197.出現第三個 10% 客戶,且兩大客戶合計不高於 40%(2025 年 42%),就把樂觀情境機率調到 30%,機率加權價值升到約 197 美元。
If it misses:落空: The top two total 45% or more: bear-case probability to 30%, probability-weighted value to about $182.兩大客戶合計 45% 以上,就把悲觀情境機率調到 30%,機率加權價值降到約 182 美元。
If it hits:達標: Arista rises to second in Dell'Oro's ranking, or reaches 19.5% of IDC's data-center share (18.7% in Q2): base case unchanged.Arista 升到 Dell'Oro 第二名,或 IDC 資料中心市占 19.5% 以上(第二季 18.7%),基準情境不動。
If it misses:落空: Cisco passes Arista (Arista drops to fourth): raise the bear-case probability to 30%.思科超過 Arista(Arista 掉到第四),就把悲觀情境機率調到 30%。
If it hits:達標: Purchase commitments (second quarter $9.7B) rise while the full-year outlook rises too: no action.採購承諾(第二季是 97 億美元)增加,但全年營收預期同步調高。本研究不動作。
If it misses:落空: Purchase commitments above $11B with no raise to the outlook: inventory risk rises and the bear-case probability goes to 30%.採購承諾超過 110 億美元,但營收預期沒有調高。囤的零件和貨賣不出去的風險升高,本研究就把悲觀情境機率調到 30%。
If it hits:達標: The first- or second-quarter 2027 report says 1.6T is shipping in volume: base-case revenue growth of 25% stays.2027 年第一、二季財報提到 1.6T 開始量產出貨。基準情境的營收成長維持 25%。
If it misses:落空: Volume slips to the second half of 2027 or later: cut 2027 revenue to $15.4B and the target to about $179.量產推遲到 2027 年下半年以後。本研究就把 2027 年營收估計降到 154 億美元,目標價約 179 美元。
If it hits:達標: NVIDIA's data-center Ethernet switch growth (IDC second quarter +181%) falls below +120%: its share grab is slowing and the bull-case probability goes to 30%.輝達資料中心乙太網路交換器的年增率(比去年同期多多少,IDC 第二季是 181%)降到 120% 以下。這代表輝達搶市占的速度放緩,本研究就把樂觀情境機率調到 30%。
If it misses:落空: Growth stays above +180%: the pressure on Arista's share is unchanged, no action.年增率維持在 180% 以上。Arista 市占被壓縮的壓力沒有變,本研究不動作。
一句話:初次評估還沒發布,外部審閱後原地修改;觀點「迴避」和目標價 191 美元不變,進場區下緣和證據門檻變嚴。
One line: the first assessment was not yet published and was revised in place after an external review; the "avoid" view and the $191 target are unchanged, while the entry-zone bottom and evidence bar are stricter.
一句話:這是 Arista 的第一份研究。股價 215.36 美元,比一年目標價 191 美元高 12.8%,所以現在不買。
One line: this is the first Arista research piece. At $215.36 the stock is 12.8% above the $191 target, so we would not buy now.
| Date日期 | View觀點 | Target price目標價 | Close收盤價 |
|---|---|---|---|
| 2026-10-08 | Avoid迴避 | 191 | $215.83 |
| 2026-10-07 | Avoid迴避 | 191 | $215.36 |
Append-only ledger.只往後加、不改舊紀錄(append-only)。
Arista in one sentence: an AI data center holds tens of thousands of chips that must be wired into one machine by network switches, and Arista has sold those switches longest and writes the best software for them. The question is not whether the business is good but how much the price already pays.
一句話說 Arista:AI 機房裡有幾萬顆晶片,要靠網路交換器接成一台機器。Arista 是賣這種交換器賣得最久、軟體也做得最好的公司。問題不在生意好不好,而在價格付了多少。
The business is solid. First-half 2026 revenue was $5.74B, up 36.5% from a year earlier; second-quarter adjusted operating margin was 49.9%; cash and securities total $13.3B with no borrowing; deferred revenue (cash collected for revenue not yet booked) is $6.87B, up from $5.37B at the end of 2025.
生意本身很扎實。2026 年上半年營收 57.4 億美元,比去年同期多 36.5%。第二季調整後營業利益率是 49.9%。現金加有價證券有 133 億美元,沒有借款。遞延收入是客戶先付錢、公司還沒算進營收的錢,有 68.7 億美元,2025 年底是 53.7 億。
This research asks three other things. First, customers: two customers make up 42%, and the share is rising. Second, profit: new revenue comes from AI and big customers, yet adjusted gross margin fell 2.2 points. Third, competition: NVIDIA, Cisco and white-box makers are all after the same AI data-center networking, and Arista ranks only third. Even so, the market pays 52 times this year's profit.
但這份研究問的是另外三件事。第一,客戶:兩家客戶占 42%,而且比例在升。第二,利潤:新增營收是 AI 和大客戶帶來的,調整後毛利率卻往下掉 2.2 個百分點。第三,競爭:輝達、思科和白牌廠都在搶同一塊 AI 機房網路,Arista 只排第三。白牌廠是沒有自有品牌、按客戶規格代工網路設備的廠商。這三件事加起來,市場卻仍然願意用 52 倍的價格買它今年的獲利。
So the conclusion is: a good company, but not at this price. It becomes worth buying when the price returns to $146-166, or when a report shows the adjusted gross margin back at 63.5% or more.
所以本研究的結論是:這是一家好公司,但不是現在的價格。價格回到 146 到 166 美元,或財報證明調整後毛利率回升到 63.5% 以上,才值得買。
Arista earns money from switches with their software and from services: in the second quarter of 2026 products were 86% of revenue and services 14%.
Arista 靠賣交換器和配套軟體、服務賺錢。2026 年第二季,產品占營收 86%,服務占 14%。
In other words, Arista sells "a chip plus its own software". Software and services hold gross margin at a little above 60%, but neither component costs nor customer discounts are in its control.
換言之,Arista 賣的是「晶片加上自己寫的軟體」。毛利率靠軟體和服務撐在 60% 出頭,但零件成本和客戶折扣都不是它能控制的。
AI training splits one job across tens of thousands of chips that compare answers after every step, so a slightly slow network leaves a whole row of costly chips waiting.
AI 訓練要把一份工作切給幾萬顆晶片一起做,每做完一步就要互相對答案。所以網路只要慢一點,整排昂貴的晶片就得停下來等。
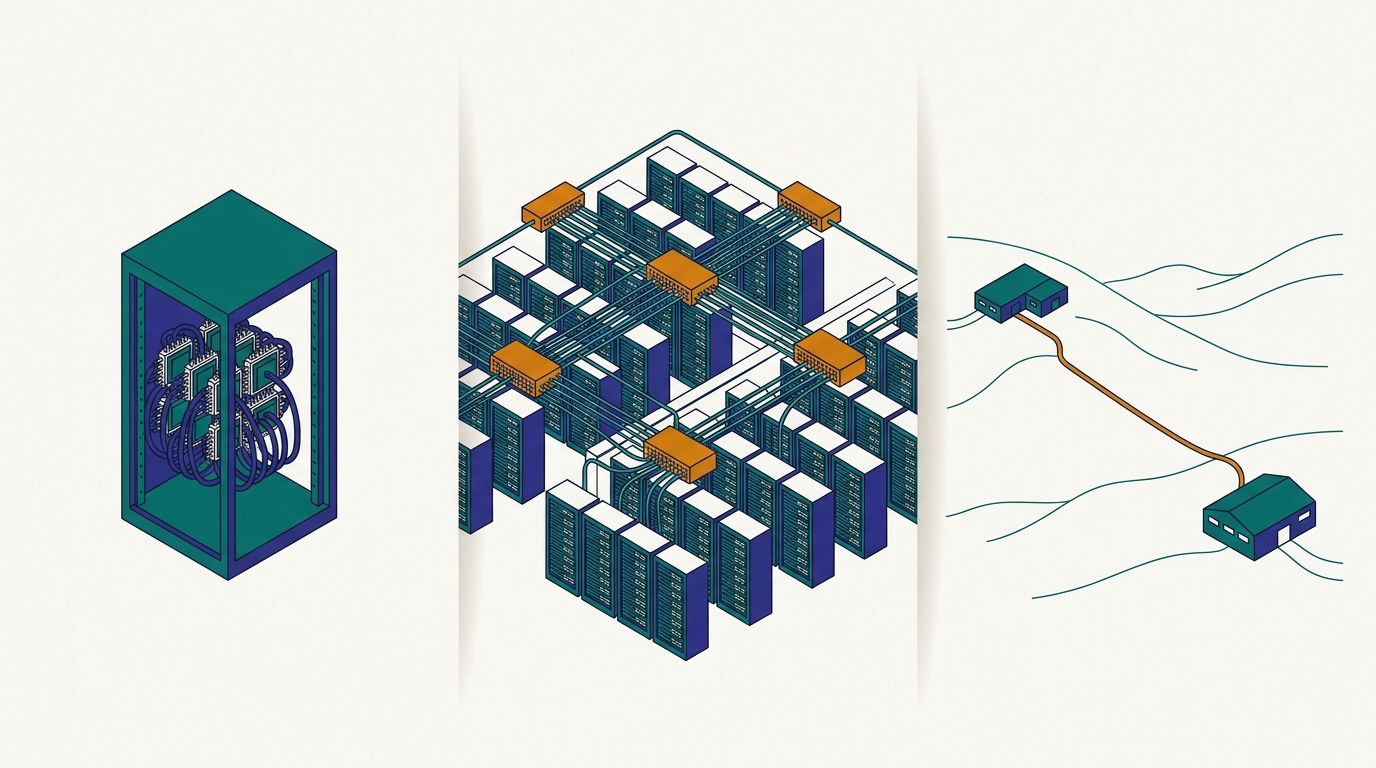
In scale-out Arista relies on two things: its operating system EOS (Extensible Operating System), one program image for every model, upgradeable without a reboot (the company calls it SSU); and new features for AI traffic: splitting one data flow across many paths and reassembling at the receiver (the MRC protocol), and using SRv6 route tags to pick each packet's path. The aim is the same: fewer idle chips.
Arista 在機房內連線靠兩樣東西。第一,作業系統 EOS(Extensible Operating System,Arista 自己寫的交換器軟體):所有機型跑同一份程式,升級時不用重開機(公司叫它 SSU)。第二,替 AI 流量做的新功能:把同一條資料流拆成多條路徑傳送,再由接收端重組(MRC 協定),並用 SRv6 路由標籤,指定每個封包(資料被切成的小包裹)走哪條路。這些功能的目的,都是讓晶片少等一點。
The next step is 1.6T (1.6 trillion bits a second per port, double today's 800G). In August Arista introduced the 7060X-E7 with 100 Tbps of system capacity and liquid-cooled options; the company says trials run in the second half of 2026 with a single-digit number of customers and volume only in 2027. The previous generation, 800G, was in trials in 2023-2024 and reached real volume only in 2025-2026.
下一步是 1.6T(每個接口每秒傳 1.6 兆位元,是現在 800G 的兩倍)。T 是兆,G 是十億,都是指每秒傳多少位元。Arista 8 月推出 7060X-E7,單台交換容量(一台機器每秒最多能轉送的資料量)100 Tbps,也有液冷版本,也就是用液體幫機器降溫。公司說,2026 年下半年開始試用,客戶只有個位數家,量產要到 2027 年。上一代 800G 在 2023 到 2024 年試用,2025 到 2026 年才開始大量出貨。
Arista has two real moats, but they protect its place in the customer's mind, not how much profit it keeps.
Arista 有兩道護城河(讓對手很難搶走客戶的優勢)是真的,但都只保護「它在客戶心中的位置」,保護不了「它能留下多少利潤」。
Whether the moat is thinning shows in public leading indicators:
護城河是不是在變薄,要看公開的領先指標:
| Observable要看什麼 | Where在哪裡看 | Reading now現在的讀數 | Threshold and meaning門檻與意義 |
|---|---|---|---|
| Adjusted gross margin調整後毛利率 | Quarterly report每季財報 | 63.4% (Q2); 65.6% a year earlier63.4%(第二季,Q2);一年前 65.6% | Two quarters below 62.5%: discounts and costs are eating the profit連續兩季低於 62.5%,代表折扣和零件成本在吃掉利潤 |
| Top-two customer share兩大客戶合計占比 | Annual 10-K年度 10-K(年報) | 42% (2025); 35% (2024); 39% (2023)42%(2025);35%(2024);39%(2023) | 45% or more: concentration grows45% 以上,代表客戶更集中 |
| AI data-center rankingAI 機房排名 | Dell'Oro quarterlyDell'Oro(調查機構)季報 | Celestica, NVIDIA, Arista, Cisco (2Q26)Celestica、輝達、Arista、思科(第二季,2Q26) | Cisco passes Arista: share squeezed思科超過 Arista,代表 Arista 的份額被擠壓 |
| Purchase commitments採購承諾 | 10-Q10-Q(季報) | $9.7B (about $3.6B a year earlier)97 億美元(一年前約 36 億) | Above $11B with no raise to outlook: inventory risk超過 110 億美元但營收預期不升,代表存貨風險 |
| Meta open-source switch generationsMeta 的開放原始碼交換器新世代 | OCP annual summit (Open Compute Project, a hardware alliance run by cloud giants)OCP 年度峰會(開放運算計畫,雲端大廠辦的硬體聯盟) | no 2026 figure found本研究未查到 2026 年的新數字 | A new generation with a large deployment jump: white-box erosion speeds up出現新世代,而且部署量大增,代表白牌廠搶生意的速度加快 |
Most of this chain is structural (data centers keep getting bigger); the cyclical part is the customers' spending rhythm, and if a big customer slows, orders drop before revenue does. The company says it has only about two quarters of visibility.
這條鏈大部分是結構性的,也就是長期趨勢(機房越建越大)。循環性的部分,是客戶的資本支出節奏,一波一波起落。一旦大客戶放慢,訂單會比營收先掉。公司自己說,只有約兩季的能見度。
The market's fear: customer concentration, falling gross margin, NVIDIA and white-box makers taking share. The company's reply: the CEO says white box suits only simple cases, EOS cannot be replaced in complex AI networks and new customers lack the staff to run white box; Arista also says price increases show only late this year or next. Independent evidence: in Dell'Oro's AI data-center ranking Celestica (a white-box maker) is first and NVIDIA second; IDC shows NVIDIA's data-center Ethernet switch revenue up 181%. Our judgment: the company is right in complex cases, but the data show more of the increment going elsewhere than it says.
市場的擔心:大客戶集中、毛利率往下、輝達和白牌廠搶市占。公司的回應:執行長說,白牌只適合簡單場景,EOS 在複雜的 AI 網路上不可取代,新客戶也沒有人力管白牌。Arista 還說,漲價要到年底或明年才會反映。獨立證據:Dell'Oro 的 AI 機房排名裡,Celestica(白牌代工廠)第一,輝達第二。IDC 顯示,輝達資料中心乙太網路交換器年增 181%。本研究的判斷:公司說的,在複雜場景成立。但數據顯示,被搶走的新增生意,比公司說的多。
If AI capital spending slows in 2027, Arista meets three things at once: orders fall first, the multiple returns to 28 times, and discounts press gross margin further. That is the $115 bear case.
如果 AI 資本支出在 2027 年放慢,Arista 會同時遇到三件事:訂單先掉、市場願付的倍數縮回 28 倍、毛利率再被折扣壓低。這就是 115 美元的悲觀情境。
The sell-side story is simple: AI networking used to belong to NVIDIA's InfiniBand, Ethernet is now winning, Arista is the biggest Ethernet specialist, so Arista wins.
賣方的故事很簡單。AI 網路過去是輝達 InfiniBand 的天下,現在乙太網路正在贏,Arista 是乙太網路最大的專業廠商,所以 Arista 贏。
The first half is right: Dell'Oro estimates Ethernet at about two thirds of AI data-center switch sales in the first quarter of 2026, with InfiniBand sales also more than tripling, so Ethernet leads but has not won outright. The second half has a hole: the Ethernet winners include NVIDIA (Spectrum-X), a white-box maker (Celestica) and Cisco, and Arista ranks only third in Dell'Oro's second-quarter table (the gap narrows considerably if its deferred AI revenue is counted).
這個故事的前半是對的。Dell'Oro 估計,2026 年第一季乙太網路約占 AI 機房交換器銷售的三分之二,InfiniBand 的銷售也成長三倍以上。所以乙太網路是領先,但沒有全贏。故事的後半有漏洞。乙太網路的贏家名單上,有輝達(Spectrum-X)、白牌代工廠(Celestica)和思科。Arista 在 Dell'Oro 第二季的排名只有第三。如果把 Arista 已收款、還沒算進營收的 AI 訂單也算進去,差距會小很多。
Valuation is where the hole shows: among the Ethernet winners, Cisco, Celestica, NVIDIA and Broadcom trade at about 20 to 25 times next year's profit and Arista at 46. The market prices it as the only winner.
估值(市場給公司的價錢)是這個漏洞的出口。同樣是乙太網路的贏家,思科、Celestica、輝達、博通的股價,是明年預估獲利的約 20 到 25 倍,Arista 是 46 倍。市場把 Arista 當成唯一的贏家在定價。
Four rivals each hold a piece. The figures come from different bodies on different bases and cannot be added together.
四個對手各占一塊。數字來自不同機構,口徑不同,不能直接相加。
| Rival對手 | Numbers數字 | Strength and pressure優勢與壓力 |
|---|---|---|
| NVIDIA (Spectrum-X)輝達(Spectrum-X) | Q2 2026 data-center Ethernet switch revenue $2.5B, +181.1%, 20.4% share, number one (IDC); Q1 was $2.1B, +192.7%, 21.5%2026 年第二季資料中心乙太網路交換器營收 25 億美元,年增 181.1%,市占 20.4%,排第一(IDC)。第一季營收 21 億美元,年增 192.7%,市占 21.5%。 | Sells GPU and network together; Arista says it has almost no part in links inside a rack in NVIDIA's NVLink stacks把 GPU 和網路一起賣。Arista 說,輝達用 NVLink 的整套方案裡,機櫃內連線幾乎沒有 Arista 的份。 |
| Cisco思科(Cisco) | Q2 total Ethernet switch revenue $5.4B, 28.7% share; data-center revenue $2.2B, 18.2% share (IDC). Fiscal Q4 2026 AI orders from hyperscalers $4B (Cisco report via MarketBeat)第二季乙太網路交換器總營收 54 億美元,市占 28.7%;資料中心營收 22 億美元,市占 18.2%(IDC)。2026 財年第四季,來自雲端大廠的 AI 訂單 40 億美元(思科財報,由 MarketBeat 網站轉述)。 | Dell'Oro says Cisco gained the most share in AI data-center networking, ranking fourthDell'Oro 說,思科在 AI 機房是份額增加最多的,排第四。 |
| Celestica and other white-box makersCelestica 等白牌代工廠 | Celestica Q2 2026 revenue $4.70B, +62%, full-year outlook $20.5B; number one in Dell'Oro's AI data-center ranking (Celestica report via MarketBeat)Celestica 2026 年第二季營收 47 億美元,年增 62%,全年預期 205 億美元。Dell'Oro 的 AI 機房排名第一(Celestica 財報,由 MarketBeat 網站轉述)。 | Customers write their own software and buy hardware from contract makers; lower prices客戶自己寫軟體、向代工廠買硬體;單價低。 |
| AristaArista | Q2 2026 IDC share 13.4% of all Ethernet switches and 18.7% of the data-center category, revenue +37.6%; third in Dell'Oro's AI data-center ranking (much closer if deferred AI revenue is counted)2026 年第二季,IDC 全部乙太網路交換器市占 13.4%,資料中心市占 18.7%,營收年增 37.6%。Dell'Oro 的 AI 機房排名第三(如果把已收款、還沒算進營收的 AI 訂單也算進去,差距會小很多)。 | Software and operations are the selling point; gross margin falling賣點是軟體和維運(日常管理),毛利率正在下降。 |
Sources split Ethernet and InfiniBand differently: Dell'Oro estimates Ethernet at about two thirds of AI data-center switch sales in the first quarter of 2026; IDC does not break out InfiniBand. We use only Dell'Oro's figure and treat it as an estimate, not a measurement.
乙太網路與 InfiniBand 的比例,各家算法不同。Dell'Oro 估計,2026 年第一季乙太網路約占 AI 機房交換器銷售的三分之二。IDC 不分開統計 InfiniBand。本研究只用 Dell'Oro 一家的數字,並把它當作估計,不當作量測值。
Fourteen terms for reading the rest of this page.
讀懂其餘章節需要的十四個名詞。
| Claim主張 | Verdict判定 | Value · source · as-of數值 · 來源 · 日期 |
|---|---|---|
| Price and valuation價格與估值 | ||
| 1. Close Oct 7收盤價 10-07 | ✓ verified已查證 | $215.83(約 216)· IBKR 日 K,2026-10-07;10-06 為 215.36 / IBKR daily bar |
| 2. 52-week low過去一年最低價 | ✓ verified已查證 | $114.52 · IBKR 日 K,2025-11-20 / daily bars |
| 3. 52-week high過去一年最高價 | ✓ verified已查證 | $217.32 · IBKR 日 K,2026-10-07(盤中高點)/ daily bars |
| 4. Jul 24 close, +24.0% since, 88% above the low7 月 24 日收盤,及漲幅 24.0%、距低點 88% | ✓ verified已查證 | $173.99(約 174)· IBKR;漲幅為本研究計算(10-06 價時為 23.8%)/ ≈174; % is own arithmetic |
| 5. Market cap about $272B市值約 2,720 億美元 | ◆ judgment本研究判斷 | 215.83 × 12.601 億基本股數(Q2 財報);stockanalysis $271.62B(其 10-07 盤中價)相近 / close |
| 6. GAAP trailing EPS $3.16, P/E 68.3過去四季一般會計每股獲利 3.16、本益比 68.3 | ◆ judgment本研究判斷 | 2.75 − 1.34 + 1.75;stockanalysis 68.16 相符 / matches |
| 7. Adjusted trailing EPS $3.47, P/E 62.2過去四季調整後每股獲利 3.47、本益比 62.2 | ◆ judgment本研究判斷 | 2.98 − 1.40 + 1.89(SEC 8-K) |
| 8. Consensus EPS: 2026 $4.11, 2027 $5.20; revenue $12.67B, $16.29B賣方共識 EPS:2026 年 4.11、2027 年 5.20;營收 126.7 億、162.9 億 | ✓ verified已查證 | Yahoo Finance 2026-10-06 · 29 位分析師 / analysts |
| 9. P/E this/next year: consensus 52.5/41.5; ours 52.1/42.9今年/明年本益比(共識)52.5/41.5;(本研究)52.1/42.9 | ◆ judgment本研究判斷 | 215.83 ÷ 4.11、5.20、4.14、5.03 |
| 10. Sell-side average target $241.93 (31 analysts, strong buy, low $190, high $289)賣方平均目標價 241.93(31 位、強力買進、最低 190、最高 289) | ✓ verified已查證 | stockanalysis · 2026-10-07 取得;頁面標示 09-30 更新 / page stamp Sep 30 |
| 11. Bernstein initiated Sep 30, outperform, target $250Bernstein 09-30 開始追蹤,優於大盤,目標價 250 | ⚠ secondary二手來源 | Dow Jones 標題經 TradingView 新聞;ad-hoc-news / headline only |
| 12. Peer forward P/E: Cisco 22.9, NVIDIA 19.8, Celestica 25.0, Broadcom 21.7; Arista 46.4同業預估本益比 思科 22.9、輝達 19.8、Celestica 25.0、博通 21.7;Arista 46.4 | ✓ verified已查證 | stockanalysis statistics · 2026-10-07 |
| 13. Peer trailing P/E 35.4/30.3/40.0/48.0同業過去四季本益比 35.4/30.3/40.0/48.0 | ✓ verified已查證 | stockanalysis · 2026-10-07(博通 47.97) |
| 14. P/E range 26.0, 25.4, 36.4, 38.6 for 2022-2025本益比區間 2022 年 26.0、2023 年 25.4、2024 年 36.4、2025 年 38.6 | ◆ judgment本研究判斷 | IBKR 月收盤年平均 29.76/43.98/84.35/115.16 ÷ 調整後 EPS 1.145/1.73/2.32/2.98(2024 為新口徑重編值;2023 為原口徑) |
| 15. Target $191 = 5.03 × 38; boundaries $212.2 and $166.1目標價 191=5.03 × 38;觀點分界價 212.2、買進價 166.1 | ◆ judgment本研究判斷 | 本研究計算:目標比收盤低 11.5%、收盤比目標高 13.0%、超出邊界 1.5 個百分點、分界價比收盤低 1.7%、悲觀比收盤低 47%、樂觀比收盤高 21%;÷0.90、÷1.15 / own arithmetic |
| 16. Case prices 115/191/262, probabilities 25/50/25, weighted $190情境價位 115/191/262、機率 25/50/25、加權 190 | ◆ judgment本研究判斷 | 4.10×28、5.03×38、5.69×46;加權 189.75;機率為判斷 / probabilities are judgment |
| 17. Sell-side target implies 46.5x; 38x needs EPS $6.37 (22% above)賣方目標隱含 46.5 倍;38 倍需 EPS 6.37(高 22%) | ◆ judgment本研究判斷 | 241.93 ÷ 5.20;241.93 ÷ 38 |
| 18. Post-November raise/cut: EPS 5.33/4.71, target 203/179, entry top 176/15611 月財報後上修/下修:EPS 5.33/4.71、目標價 203/179、進場區上緣 176/156 | ◆ judgment本研究判斷 | 營收 168/154 億、營業利益率 48.5%/46.5% 重算 / recomputed |
| 19. Weighted value $197 and $182 (probability shifted to 30%)機率加權價值 197、182(情境機率改為 30%) | ◆ judgment本研究判斷 | 本研究計算 |
| Financials and guidance財報與財測 | ||
| 20. Q2 2026 revenue $3,035.7M, +37.7% YoY, +12.1% QoQ2026 年第二季營收 30.357 億,年增 37.7%,季增 12.1% | ✓ verified已查證 | Arista 8-K(SEC)2026-08-04;$3,035.7M ≈ 30.36 億 ≈ 30.4 億 ≈ $3.04B |
| 21. First quarter above $3B第一次單季營收超過 30 億美元 | ✓ verified已查證 | Arista 8-K 2026-08-04 |
| 22. H1 revenue $5,744.7M vs $4,209.6M (+36.5%)上半年營收 57.447 億,對 42.096 億(+36.5%) | ✓ verified已查證 | Arista 8-K;增幅為計算 / % computed |
| 23. GAAP gross margin 62.9% (65.2%); adjusted 63.4% (65.6%)一般會計毛利率 62.9%(一年前 65.2%);調整後 63.4%(65.6%) | ✓ verified已查證 | Arista 8-K 2026-08-04;10-Q |
| 24. Adjusted operating margin 49.9% (48.8%); GAAP 45.4% (44.7%)調整後營業利益率 49.9%(48.8%);一般會計 45.4%(44.7%) | ✓ verified已查證 | Arista 8-K 2026-08-04 |
| 25. Q2 EPS: GAAP 0.95, adjusted 1.02; H1 adjusted 1.89第二季每股獲利:一般會計 0.95、調整後 1.02;上半年調整後 1.89 | ✓ verified已查證 | Arista 8-K |
| 26. Q2 revenue 8% above the $2.8B guide; Q1 $2.709B 4% above the $2.6B guide第二季營收比指引 28 億高 8%;第一季 27.09 億比指引 26 億高 4% | ✓ verified已查證 | Arista 8-K 2026-05-05、08-04 |
| 27. Q3 guide: revenue ~$3.3B, adjusted GM ~63%, operating margin 48-49%, EPS $1.06-1.08, 1.279B shares, tax 21.5%第三季指引:營收約 33 億、調整後毛利率約 63%、營業利益率 48–49%、EPS 1.06–1.08、稀釋股數 12.79 億、稅率 21.5% | ✓ verified已查證 | Arista 8-K;電話會 CFO / CFO on call |
| 28. FY26 outlook: revenue ~$12.6B (+40%); AI at least $3.5B; campus at least $1.25B; GM 62-64%; operating margin 48-49%2026 年指引:營收約 126 億(+40%);AI 網路至少 35 億;校園至少 12.5 億;毛利率 62–64%;營業利益率 48–49% | ✓ verified已查證 | 電話會 2026-08-04(CFO 說 AI 為 35 億;CEO 口述 36 億,採 CFO)/ CFO says $3.5B, CEO said $3.6B, CFO figure used |
| 29. Third raise this year; analyst-day goal $10.5B; May $11.5B2026 年內第三次調高;分析師日目標 105 億;5 月 115 億 | ✓ verified已查證 | 電話會 CEO 2026-08-04 |
| 30. Scale-across about 30% of the AI target (~$1.1B); market $3-4B in 2026, $15-20B in 2030Scale-across 約占 AI 目標 30%(約 11 億);市場 2026 年 30–40 億、2030 年 150–200 億 | ✓ verified已查證 | 電話會 CEO;市場數字為其引用的市場研究,未見原文 / market figures are CEO-cited research |
| 31. FY2025 revenue $9,005.7M (+28.6%); GAAP EPS 2.75; adjusted 2.98; adjusted GM 64.6%; operating margin 48.2%2025 年營收 90.057 億(+28.6%);一般會計 EPS 2.75;調整後 2.98;調整後毛利率 64.6%;營業利益率 48.2% | ✓ verified已查證 | Arista 10-K 2026-02-17;Q4 8-K 2026-02-12;≈ $9.01B(90.06 億) |
| 32. Q2 product $2,605.2M, service $430.5M (86%/14%)第二季產品 26.05 億、服務 4.31 億(86%/14%) | ✓ verified已查證 | Arista 8-K / 10-Q |
| 33. Q2 Americas $2,337.9M (77%), EMEA $438.2M, APAC $259.6M第二季美洲 23.38 億(77%)、歐非中東 4.38 億、亞太 2.60 億 | ✓ verified已查證 | Arista 10-Q;≈ 23.4、4.4、2.6 億 |
| 34. Two largest customers: 26%+16%=42% (2025); 20%+15%=35% (2024); 18%+21%=39% (2023)兩大客戶:2025 年 26%+16%=42%;2024 年 20%+15%=35%;2023 年 18%+21%=39% | ✓ verified已查證 | Arista 10-K(匿名;合計為計算)/ anonymous, sums computed |
| 35. CEO names Microsoft and Meta as the two longest partners; expects one or two new 10% customersCEO 稱微軟、Meta 為「最長的兩位夥伴」並預期一到兩個新的 10% 客戶 | ✓ verified已查證 | 電話會 2026-08-04(逐字稿);10-K 未具名 / 10-K does not name |
| 36. Cash $2,290.2M + securities $11,053.1M = $13,343.3M現金 22.90 億+有價證券 110.53 億=133.43 億 | ✓ verified已查證 | Arista 8-K 2026-06-30;≈ $13.34B |
| 37. Deferred revenue $6.87B ($5,100.7M + $1,765.2M); $5.37B at end-2025遞延收入 68.7 億(51.0+17.65);2025 年底 53.7 億 | ✓ verified已查證 | Arista 8-K;≈ $13.34B |
| 38. Inventory $2,535.3M; $2,247.1M at end-2025存貨 25.35 億;2025 年底 22.47 億 | ✓ verified已查證 | Arista 8-K;≈ $2.54B、$2.25B(22.5 億) |
| 39. Purchase commitments $9.7B ($9.4B within 12 months); about $3.6B a year earlier採購承諾 97 億(94 億於 12 個月內);一年前約 36 億 | ✓ verified已查證 | 10-Q 2026-08-05;CEO 電話會 / CEO on call |
| 40. Stock pay Q2 $120.4M (+41%); H1 $241.3M (+35%)股票薪酬第二季 1.204 億(+41%);上半年 2.413 億(+35%) | ✓ verified已查證 | Arista 8-K |
| 41. No buybacks in 2026; $983M in H1 2025; $817.9M authorization left; VeloCloud bought for $300M in June 20252026 年沒有買回庫藏股;2025 上半年 9.83 億;核准額度剩 8.179 億;2025 年 6 月以 3 億買下 VeloCloud | ✓ verified已查證 | 8-K;電話會 CFO;10-Q;$817.9M ≈ $818M(8.18 億) |
| 42. Never paid a dividend從未配息 | ✓ verified已查證 | 10-K 股利政策 / dividend policy |
| 43. Gross margin fell because of more sales to large customers with bigger discounts毛利率下降原因:賣給大客戶比重升高、折扣較多 | ✓ verified已查證 | 10-Q 2026-08-05 |
| 44. Price increases show late this year or next; tariff refund about 20-30 bp of gross margin漲價要到年底或明年才反映;關稅退款對毛利率約 20–30 個基點 | ✓ verified已查證 | 電話會 CEO、CFO 2026-08-04 |
| 45. 800G: trials 2023-24, ramp 2025-26; 1.6T: trials H2 2026 with a single-digit number of customers, volume 2027800G:2023–24 試用、2025–26 放量;1.6T:2026 下半年試用、個位數客戶、2027 量產 | ✓ verified已查證 | 電話會 CEO 2026-08-04 |
| 46. 7060X-E7: 100 Tbps, 1.6T, liquid-cooled options7060X-E7:100 Tbps、1.6T、含液冷 | ✓ verified已查證 | Arista 8-K 2026-08-04 |
| 47. About two quarters of visibility; memory secured for 2026 with 2027 visibility; three contract manufacturers能見度約兩季;記憶體鎖定到 2026 年、2027 年有能見度;三家代工廠 | ✓ verified已查證 | 電話會 CFO、COO 2026-08-04 |
| 48. Switch chips rely mainly on Broadcom交換晶片主要依賴博通 | ✓ verified已查證 | 10-K、10-Q |
| 49. New global operations head Eugenia Corrales新聘全球營運主管 Eugenia Corrales | ✓ verified已查證 | 電話會 CEO 2026-08-04 |
| 50. Scale-up a new opportunity from 2027 (ESUN)Scale-up 為 2027 年起的新機會(ESUN) | ✓ verified已查證 | 10-K;Q1 電話會 2026-05-05 |
| Industry and peers產業與同業 | ||
| 51. IDC 2Q26: NVIDIA $2.5B, +181.1%, 20.4%; Arista 18.7% of data center, 13.4% overall, +37.6%; Cisco $5.4B (28.7%), data center $2.2B (18.2%)IDC 2Q26:輝達資料中心乙太網路交換器 25 億、+181.1%、20.4%;Arista 資料中心 18.7%、全部 13.4%、+37.6%;思科 54 億(28.7%)、資料中心 22 億(18.2%) | ✓ verified已查證 | IDC Markets and Trends 2026-09-11 |
| 52. IDC 1Q26: NVIDIA $2.1B, +192.7%, 21.5%IDC 1Q26:輝達 21 億、+192.7%、21.5% | ✓ verified已查證 | IDC 部落格 2026-06-17 |
| 53. Dell'Oro: Ethernet about two thirds of AI data-center switch sales in 1Q26, InfiniBand up more than 3x; 2Q26 ranking Celestica, NVIDIA, Arista, CiscoDell'Oro:1Q26 乙太網路約占 AI 機房交換器三分之二,InfiniBand 成長三倍以上;2Q26 排名 Celestica、輝達、Arista、思科 | ✓ verified已查證 | Dell'Oro 2026-06-02、2026-09-03 |
| 54. Cisco fiscal Q4 2026: $4B AI orders from hyperscalers思科 2026 財年第四季:雲端大廠 AI 訂單 40 億美元 | ⚠ secondary二手來源 | MarketBeat/Futurum 轉述 2026-08-12(二手)/ secondary |
| 55. Celestica Q2 2026 revenue $4.70B (+62%); full-year outlook $20.5BCelestica 2026 年第二季營收 47 億(+62%);全年預期 205 億 | ⚠ secondary二手來源 | MarketBeat 轉述 2026-07-28(二手)/ secondary |
| 56. Q3 report date Nov 3, 2026, after the US close第三季財報日 2026-11-03(美股收盤後) | ✓ verified已查證 | Arista 新聞稿 2026-10-06(經 BusinessWire/StockTitan 轉載;arista.com 擋住自動讀取) |
| 57. Insider sales: Ullal 1,686,813 shares in Aug ($343M); Bechtolsheim 1,011,848 shares ($201M); all cite 10b5-1內部人賣股:Ullal 8 月 1,686,813 股(3.43 億);Bechtolsheim 8 月 1,011,848 股(2.01 億);皆註明 10b5-1 | ✓ verified已查證 | SEC Form 4,本研究加總 / our tally of Form 4 filings |
| Model inputs and thresholds本研究模型輸入與門檻 | ||
| 58. Model inputs: Q3/Q4 revenue $3.40B/$3.62B, FY26 $12.76B, FY27 $16.0B (+25.3%), 1.285B shares, tax 21.5%, operating margin 48.8%/48.0%, gross margin about 63%/62.5%模型輸入:第三、第四季營收 34.0/36.2 億 → 2026 年 12.76B(=57.447+34.0+36.2 億);2027 年營收 16.0B(+25.3%);稀釋股數 12.85 億;稅率 21.5%;營業利益率 2026 年 48.8%、2027 年 48.0%;毛利率約 63%/62.5% | ◆ judgment本研究判斷 | 本研究假設;依據:公司指引、過去兩季超出指引 4%/8%、第三季指引股數 12.79 億 / assumptions |
| 59. Case revenue $13.8B/$16.0B/$17.8B, operating margin 45/48/49%情境營收 138/160/178 億、營業利益率 45/48/49% | ◆ judgment本研究判斷 | 本研究假設 |
| 60. Thresholds: adjusted gross margin 62.5%/63.5%; outlook $13.2B; commitments $11B; top-two share 40%/45%; IDC share 19.5%; NVIDIA growth 120%/180%觀察門檻:調整後毛利率 62.5%/63.5%;全年預期 132 億;採購承諾 110 億;兩大客戶 40%/45%;IDC 資料中心占比 19.5%;輝達年增 120%/180% | ◆ judgment本研究判斷 | 本研究事先設定 / pre-set by this analysis |
| 61. Trim line $240 (about 48x, 240 ÷ 5.03); $255 after a raise (about 48 × 5.33)減碼線 240(約 48 倍,240 ÷ 5.03);上修後 255(≈ 48 × 5.33) | ◆ judgment本研究判斷 | 本研究計算 |
| 62. Entry zone $146-166: top = 191 ÷ 1.15; bottom = 168 ÷ 1.15 (168 = 28.3 × 5.94)進場區 146 到 166:上緣=191 ÷ 1.15;下緣=168 ÷ 1.15(168=28.3 × 5.94) | ◆ judgment本研究判斷 | 本研究計算與判斷 |
| 63. 2028 estimate: revenue +18% to $18.88B, operating margin 48%, other income $0.70B, tax 21.5%, 1.29B shares, EPS $5.94 (+18%); EPS growth +39%, +21.5%, +18% for 2026, 2027, 20282028 年估計:營收 +18% 到 188.8 億、營業利益率 48%、其他收入 7 億、稅率 21.5%、股數 12.9 億,每股獲利 5.94(比 2027 年多 18%);2026、2027、2028 年每股獲利成長 +39%、+21.5%、+18% | ◆ judgment本研究判斷 | 本研究假設,不是從供應時間表推出來的;供應吃緊(執行長 2026-08-04 電話會)只用來限制 2027 年成長約 30%,供應提早鬆開是 2028 年的上行風險;成長率為 4.14/2.98、5.03/4.14、5.94/5.03 計算 |
| 64. Growth cases 20/25/30% (2028: 15/18/22%): 2027 EPS 4.84/5.03/5.22; 2028 EPS 5.59/5.94/6.36; same-year prices (34/38/42/46x) and forward prices (28/32/36/40x)成長情境 20/25/30%(2028 年 15/18/22%):2027 年每股獲利 4.84/5.03/5.22;2028 年 5.59/5.94/6.36;同年算法價格(34/38/42/46 倍)與遠期算法價格(28/32/36/40 倍) | ◆ judgment本研究判斷 | 本研究計算:營收 15.36/16.0/16.64 十億美元;營業利益率 48%;股數 12.85 億(2028 年 12.9 億)。同年算法價格(括號為對 2028 年獲利的倍數):20% 成長 165(29.5)/184(32.9)/203(36.4)/223(39.9);25% 成長 171(28.8)/191(32.2)/211(35.5)/231(38.9);30% 成長 177(27.9)/198(31.2)/219(34.5)/240(37.7)。遠期算法價格:20% 156/179/201/223;25% 166/190/214/238;30% 178/203/229/254 |
| 65. Year-end prices (December closes) 30.34 / 58.88 / 110.53 / 131.03年底股價(12 月收盤)30.34/58.88/110.53/131.03 | ✓ verified已查證 | IBKR 月 K,2022 至 2025 年 12 月 / IBKR monthly bars |
| 66. Forward range: year-average price ÷ next year's actual EPS 17.2/19.0/28.3 (2022-2024); year-end price ÷ same-year EPS 26.5/34.0/47.6/44.0; year-end price ÷ next-year actual EPS 17.5/25.4/37.1遠期區間:年平均股價 ÷ 下一年實際獲利 17.2/19.0/28.3(2022–2024);年底股價 ÷ 當年獲利 26.5/34.0/47.6/44.0;年底股價 ÷ 下一年實際獲利 17.5/25.4/37.1 | ◆ judgment本研究判斷 | IBKR 月 K 與 SEC 財報(調整後 EPS 1.145/1.73/2.32/2.98;2024 年為重編值);現在高出上緣:A 13.5、B 14.6、C 4.5 倍 |
| 67. stockanalysis historical forward P/E (year-end price; secondary; method not fully disclosed): 23.5, 33.6, 46.9, 40.9 for 2022-2025; today 46.4; four-year average 36.2; 2023-2025 average 40.4stockanalysis 歷史預估本益比(年底股價,二手;算法細節未公開):2022 年 23.5、2023 年 33.6、2024 年 46.9、2025 年 40.9;現在 46.4;四年平均 36.2;三年(2023–2025)平均 40.4 | ⚠ secondary二手來源 | stockanalysis 財務比率頁 · 2026-10-07 取得 / ratios page; averages are own arithmetic |
| 68. Second target basis: 28.3 × 5.94 = 168; 36.2 × 5.94 = 215; 191 ÷ 5.94 = 32.2; 198 at 30% growth (8% below)目標價第二算法:28.3 × 5.94 = 168;36.2 × 5.94 = 215;191 ÷ 5.94 = 32.2;成長 30% 時 198(低 8%) | ◆ judgment本研究判斷 | 本研究計算 |
| 69. Sell-side target multiples: 241.93 ÷ 6.36 = 38.0; ÷ 5.94 = 40.7; the $51 gap is about a quarter earnings path and three quarters multiple; the 2028 consensus is an assumption賣方目標隱含倍數:241.93 ÷ 6.36 = 38.0;÷ 5.94 = 40.7;差距 51 美元約四分之一來自獲利路徑、約四分之三來自倍數;賣方 2028 年共識為假設 | ◆ judgment本研究判斷 | 本研究計算;賣方 2028 年共識取不到(付費牆) |
| 70. Sensitivity reading: of 12 cells 5 are more than 10% below, 7 range-bound, none at 15%; best $240 (+11%); a 15% gain needs $248.2 = 49.3x 2027 EPS; weights 30/50/20 give $182 and 20/50/30 give $197敏感度判讀:12 格中 5 格低於現價 10% 以上、7 格區間、0 格達 15%;最好 240(+11%);漲 15% 需 248.2=2027 年獲利的 49.3 倍;權重 30/50/20 加權 182,20/50/30 加權 197 | ◆ judgment本研究判斷 | 本研究計算 |
| 71. Evidence: purchase commitments $9.7B are 2.7x a year earlier (about $3.6B); deferred revenue $6.87B is 28% above $5.37B at end-2025證據:採購承諾 97 億是一年前(約 36 億)的 2.7 倍;遞延收入 68.7 億比 2025 年底 53.7 億多 28% | ◆ judgment本研究判斷 | 由 10-Q 與 8-K 數字計算 / computed from verified rows |
| 72. Adjusted gross margin bridge: GAAP gross profit $1,910.3M + stock pay $7.4M + amortization $7.0M = $1,924.7M; tariff refund about 20-30 bp; about 63.1-63.2% without it調整後毛利率 63.4% 的橋:一般會計毛利 1,910.3 百萬 + 股票薪酬 7.4 + 攤銷 7.0 = 1,924.7;關稅退款約 20–30 個基點;扣除後約 63.1–63.2% | ✓ verified已查證 | Arista 8-K 2026-08-04(毛利 19.103 億、調整後 19.247 億;股票薪酬 740 萬、攤銷 700 萬,合計 1,440 萬,即 $14.4M);財務長電話會 2026-08-04;扣除後數字為計算 |
| 73. PEG-style ratios: 42.9 ÷ 21.5 = 2.0; 41.5 ÷ 26.5 = 1.6; 42.9 ÷ 25.3 = 1.7PEG 式比值:42.9 ÷ 21.5 = 2.0;41.5 ÷ 26.5 = 1.6;42.9 ÷ 25.3 = 1.7 | ◆ judgment本研究判斷 | 本研究計算;共識成長為 5.20/4.11 |
| 74. Peer context: Cisco revenue +18% (fiscal Q4 2026); Celestica segment margin 8.7%; NVIDIA gross margin 75.0%; NVIDIA market cap $5.78T同業說明:思科營收 +18%(2026 財年第四季);Celestica 部門利潤率 8.7%;輝達毛利率 75.0%;輝達市值 5.78 兆美元 | ⚠ secondary二手來源 | MarketBeat/Futurum/新聞轉述(二手);市值為 stockanalysis 2026-10-07 |
| 75. From the low: 215.83 ÷ 114.52 = +88%; $176 is 18% below 215.83從低點到現在:215.83 ÷ 114.52 = +88%;176 比 215.83 低 18% | ◆ judgment本研究判斷 | 本研究計算 |
| Dropped已刪除 | ||
| 76. NVIDIA full-year networking revenue $31.38B as 3.48x Arista輝達全年網路營收 313.76 億為 Arista 的 3.48 倍 | ✗ dropped已刪除 | 刪除:口徑含 NVLink,與 Arista 不重疊 / includes NVLink |
| 77. Meta FBOSS deployment share; white-box penetration in AI data centers of 20-25%Meta FBOSS 部署占比、AI 機房白牌滲透率 20–25% | ✗ dropped已刪除 | 刪除:查無權威數字 / no authoritative figure |
| 78. Ten-year median P/E of 40.85x十年本益比中位數 40.85 倍 | ✗ dropped已刪除 | 刪除:口徑為一般會計過去四季,與本研究區間不同 / different basis |
| 79. Microsoft about 26%, Meta about 16% attribution微軟約 26%、Meta 約 16% 的逐家歸屬 | ✗ dropped已刪除 | 刪除:10-K 匿名;只保留 CEO 說的兩家名稱 / only the CEO's naming kept |