$560.00
Last最新價 ✓ IBKR · 07-22
The picks-and-shovels enabler of chip complexity. The reasoning is the model's; every number carries its source and date. Where the first draft ran on memory, live data rewrote the conclusion. 晶片複雜度背後「賣鏟子」的設備商。推論由模型產生,但每個數字都標註來源與日期。第一版靠記憶寫成的地方,即時資料改寫了結論。
How this is built. A variant-perception framework — the discipline of ignoring consensus to find what the market may be misunderstanding, underestimating, or ignoring. It walks the same nine steps for any stock: business → bull → bear → the variant view → catalysts → management → moat → probability-weighted odds → what it takes to double. The rule that makes it trustworthy: no number is written from memory — every figure is grounded to a filing or live data with a date, and the share price is recomputed the moment this page is built.
我們是怎麼分析這家公司的。採用「變異觀點(Variant Perception)」框架 — 刻意不跟市場共識走,去找市場可能誤解、低估或忽略的地方。對任何一檔股票都走同樣九個步驟:本業 → 多方 → 空方 → 變異觀點 → 催化劑 → 經營層 → 護城河 → 機率加權情境 → 翻倍需要什麼。讓它可信的關鍵規則:沒有任何數字憑記憶寫成 — 每個數字都標註來自財報或即時資料與日期,股價在生成這頁的當下即時重算。
The variant bull case is "the market underestimates how long AI-driven chip complexity lifts equipment demand, so a re-rating is coming." AMAT peaked at $739.67 intraday around 07-01, then gave back -24% in three weeks to $560.00 (07-22 close, still +118% YTD) ✓ IBKR · 07-22. Forward P/E is now ~46× on FY26 consensus EPS $12.26 (39 analysts) ✓ stockanalysis · 07-15, ~33× on FY27's $16.75; trailing ~52× TTM ✗→ was ~55×/~76× at 06-30 prices06-30 版為 ~55×/~76×.
變異多方論點是:「市場低估了 AI 帶動的晶片複雜度會把設備需求撐多久,所以還有一波評價重估。」AMAT 於 07-01 前後盤中見頂 $739.67,隨後三週回落 -24% 至 $560.00(07-22 收盤,年初至今仍 +118%)✓ IBKR · 07-22。預估本益比降至約 46 倍(FY26 共識 $12.26,39 位分析師)✓ stockanalysis · 07-15,以 FY27 共識 $16.75 計約 33 倍;歷史本益比約 52 倍(TTM)✗→ 06-30 版為 ~55×/~76×。
The 06-30 finding said the re-rating was largely done and warned: priced for perfection — any wobble compresses the multiple. The wobble came (07-02 HBM-slowdown scare, 07-07 Samsung print), and the multiple compressed — while AMAT's own fundamentals strengthened (FQ3 guide +13% QoQ, TSMC capex raised to $60-64B, customer visibility "to 2030"). The question has moved from "is there edge after a double" to "does FY27's +37% consensus EPS survive the memory-capex cycle" — see the 07-23 update below and the playbook at the end. ◆
06-30 版結論說重估大半已反應,並警告:完美定價 — 一有閃失,本益比就收縮。閃失來了(07-02 HBM 放緩傳聞、07-07 三星財報),本益比也真的收縮了 — 但 AMAT 自身基本面反而更強(FQ3 指引 QoQ +13%、台積電 capex 上修至 $60-64B、客戶能見度「到 2030」)。問題已從「翻倍後還有沒有超額」變成 「FY27 共識 EPS +37% 撐不撐得過記憶體資本支出週期」 — 詳見下方 07-23 更新與文末操作框架。◆
Dated additions, newest first. The core thesis above stays as-is unless an entry says otherwise.
逐則標日期、最新在上。除非條目另外註明,上方核心論點維持不變。
The tape. $723.00 all-time closing high 06-30 → $739.67 intraday ~07-01 → -7.4% on 07-02 (report that SK Hynix is slowing part of its HBM4 expansion) → ~-10% on 07-07 (Samsung's record ₩89.4T preliminary OP still missed the "AI bar") → $529.66 trough 07-17 (~-27% off the closing high) → rebound after CEO Gary Dickerson described customer equipment forecasts extending "to 2030" → $560.00 close 07-22 ✓ IBKR · 07-22 + CNBC/MacroTrends. Michael Burry disclosed a short position at ~$729 on 06-30 ⚠ single outlet單一來源.
盤面。06-30 收盤歷史高 $723.00 → 約 07-01 盤中 $739.67 → 07-02 -7.4%(SK海力士(000660.KS) 傳出放緩部分 HBM4 擴產)→ 07-07 約 -10%(三星(005930.KS) 初步營益 ₩89.4兆 創紀錄仍不及「AI 標準」)→ 07-17 低點 $529.66(距收盤高點約 -27%)→ CEO Gary Dickerson 稱客戶設備需求預測「看到 2030」後反彈 → 07-22 收 $560.00 ✓ IBKR · 07-22 + CNBC/MacroTrends。Michael Burry 於 06-30 揭露在約 $729 的空頭部位 ⚠ 單一來源。
What strengthened while the stock fell. FQ2 FY26 (reported 05-14): record revenue $7.91B (+11% YoY), non-GAAP EPS $2.86 (+20%), China down to 27% of revenue; FQ3 guide $8.95B ±$0.5B / EPS $3.36 ±$0.20 — implying ~+13% QoQ ✓ GlobeNewswire 05-14. TSMC(TSM.N) raised 2026 capex to $60-64B from $52-56B (07-16); Micron(MU.O) lifted FY26 capex to ~$27B; SK hynix raised $26.5B on NASDAQ earmarked for fabs + EUV ✓ transcripts/filings 06-24~07-16. FQ3 EPS revisions past 90 days: 25 up, 0 down ✓ Investing.com 07-21. July target hikes into the selloff: TD Cowen $700 · UBS $705 · Stifel $650 · GS $645; street average $623.06 (39 analysts) ✓ stockanalysis · 07-15.
股價下跌的同時,基本面反而變強。FQ2 FY26(05-14 公布):營收 $7.91B 創紀錄(YoY +11%)、非 GAAP EPS $2.86(+20%)、中國占比降至 27%;FQ3 指引 $8.95B ±$0.5B/EPS $3.36 ±$0.20 — 隱含 QoQ 約 +13% ✓ GlobeNewswire 05-14。台積電(TSM.N) 2026 capex 自 $52-56B 上修至 $60-64B(07-16);美光(MU.O) FY26 capex 升至約 $27B;SK海力士在 NASDAQ 募得 $26.5B 全數投入廠房與 EUV ✓ 法說/申報 06-24~07-16。90 天內 FQ3 EPS 修正:上修 25 次、下修 0 次 ✓ Investing.com 07-21。7 月逆勢調升目標價:TD Cowen $700 · UBS $705 · Stifel $650 · 高盛 $645;賣方平均 $623.06(39 位)✓ stockanalysis · 07-15。
Numbers refreshed. Price $713.00 → $560.00 (-21.5% vs the 06-30 build; IBKR 07-22); YTD +177.8% → +118.2%; market cap ~$560B → $444.6B (793,959,430 shares, 10-Q 04-26 ✓ SEC); forward P/E ~55× → ~46× — and the FY26 consensus EPS denominator is corrected to $12.26 (stockanalysis, 39 analysts, 07-15) ✗→ replaces the ~$13.0 secondary figure取代 ~$13.0 次級數字; FY27 consensus EPS $16.75 (+37%) → ~33× at the live price. CEO Dickerson sold 78,321 shares for ~$55.5M at ~$700-736 on 06-29/30 — at the top, filed 07-01 ✓ SEC Form 4.
數字已更新。股價 $713.00 → $560.00(較 06-30 版 -21.5%;IBKR 07-22);YTD +177.8% → +118.2%;市值約 $560B → $444.6B(793,959,430 股,10-Q 04-26 ✓ SEC);預估本益比 ~55× → 約 46× — 且 FY26 共識 EPS 分母修正為 $12.26(stockanalysis,39 位,07-15)✗→ 取代 ~$13.0 次級數字;FY27 共識 EPS $16.75(+37%)→ 以現價計約 33 倍。CEO Dickerson 於 06-29/30 以約 $700-736 賣出 78,321 股、約 $55.5M — 正在頂點,07-01 申報 ✓ SEC Form 4。
How it bears on the thesis. The 06-30 warning — priced for perfection, any wobble compresses — executed to the letter, except the wobble was the customers' capex sentiment, not AMAT's own numbers. The de-rating the finding said was needed has begun (~55×→~46×). The live question is now FY27: consensus embeds +37% EPS growth that assumes the 2027 memory-capex wave lands intact — the same wave whose durability is the open question across this desk's memory coverage. This update also adds the playbook section below (the page predates the decision-layer format). ◆ framing = judgment定位=判斷
對論點的影響。06-30 的警告 — 完美定價、一有閃失就收縮 — 逐字兌現,只是閃失來自客戶端的資本支出情緒,不是 AMAT 自己的數字。結論所說「需要的去評價」已經開始(~55×→~46×)。現在的活問題是 FY27:共識隱含 EPS +37%,前提是 2027 記憶體資本支出波完整落地 — 而那波的持續性,正是本站記憶體研究裡懸而未決的同一個問題。本次更新同時補上文末操作框架(本頁早於 decision-layer 格式)。◆ 定位=判斷
Re-pulled live: $713.00, +177.8% YTD, a fresh 52-week high ✓ IBKR · 06-30 — up another ~21% from the $589 build price. Yet the forward P/E fell to ~55× (vs ~57× at build), because consensus FY26 EPS was revised up to ~$13.0 (from ~$10.4) and the FY26 revenue forecast lifted to ~$33.3B (from ~$31.6B) ✓ Yahoo / Simply Wall St · ~06-26. Driver: a high-conviction product showcase plus a wave of Wall-Street target upgrades.
即時重抓:$713.00、年初至今 +177.8%、創 52 週新高 ✓ IBKR · 06-30 — 比生成時的 $589 又漲約 21%。但預估本益比反而降到約 55 倍(生成時約 57 倍),因為市場把 FY26 每股盈餘共識上修到約 $13.0(原約 $10.4)、FY26 營收預估也升到 約 $33.3B(原約 $31.6B)✓ Yahoo/Simply Wall St · 約 06-26。推力:一場高聲量的產品發表,加上多家華爾街調升目標價。
How it changes the finding. The headline above said the re-rating was largely done and a further double would need earnings growth (engine 1), not multiple expansion. That is now visibly happening: the multiple compressed while the price rose, because the E got marked up — engine 1 is firing, partly validating the variant bull. The flip side hardens too: at +178% YTD and a fresh high (~76× trailing on FY25 EPS; TTM since risen), the "priced-for-perfection, any-wobble-compresses" bear is sharper, and "edge after a double" now means going from ~$560B to ~$1.1T+. Net: not more bullish, not more bearish — the core tension is resolving in real time, with estimates doing the work the thesis said they would have to. ◆ framing = judgment定位=判斷
對結論的影響。上方結論說評價重估大半已發生,要再翻倍得靠獲利成長(引擎一)、而非評價擴張。現在這件事正在發生:股價漲、本益比反而收縮,因為E 被上修了 — 引擎一正在點火,部分驗證變異多方。但另一面也更硬:在年初至今 +178%、又創新高(以 FY25 EPS 算約 76 倍歷史本益比,惟 TTM 已上升)之下,「完美定價、一有閃失就收縮」的空方更尖銳;而「翻倍後還有沒有超額」如今是指從約 $560B 翻到約 $1.1 兆以上。淨結論:沒有更偏多、也沒有更偏空 — 核心張力正即時化解,且正是靠獲利上修在做事。◆ framing = judgment定位=判斷
On 2026-06-16, EssilorLuxottica (the Ray-Ban / Oakley owner) and Applied Materials signed a long-term joint development agreement for next-generation intelligent optical systems in AR / AI smart glasses. It pairs EssilorLuxottica's lenses-frames-eyewear scale with AMAT's materials engineering and waveguide expertise; scope covers waveguides, adaptive (auto-dimming) lenses, materials innovation and advanced lens packaging, with a dedicated joint lab on AMAT's Silicon Valley campus. ✓ GlobeNewswire · 06-16
2026 年 6/16,EssilorLuxottica(Ray-Ban/Oakley 母公司)與應用材料簽署長期共同開發合約,鎖定 AR/AI 智慧眼鏡的次世代智慧光學系統。結合 EssilorLuxottica 的鏡片-鏡框-眼鏡規模,與 AMAT 的材料工程與導波路(waveguide)技術;範圍涵蓋導波路、適應型調光鏡片、材料創新、先進鏡片封裝,並在 AMAT 矽谷園區設專用聯合實驗室。✓ GlobeNewswire · 06-16
How it bears on the thesis. This is optionality, not a near-term number. It supports the variant view that AMAT's materials-engineering moat is broader than core semi WFE — extending into a large new AR-optics TAM. But it is an early-stage R&D agreement (a joint lab, no disclosed revenue or timeline), so it does not change the headline finding above: at ~57× forward P/E the re-rating is largely done, and edge-after-a-double still depends on earnings growth (engine 1), not this. Treat it as a multi-year call option on AMAT's TAM, not a 2026 catalyst. ◆ framing = judgment定位=判斷
對論點的意義。這是選擇權式的想像空間(optionality),不是近期數字。它支持「AMAT 的材料工程護城河不只在核心半導體 WFE、能延伸到一塊很大的新 AR 光學 TAM」這個變異觀點。但它是早期 R&D 合約(只設聯合實驗室,未揭露營收或時程),所以不改變上方的結論:約 57 倍預估本益比下,評價重估大半已發生,翻倍後還有沒有超額報酬,仍取決於獲利成長(引擎一),而非此案。把它當成 AMAT 市場規模(TAM)的「多年期買權」,而不是 2026 年的催化劑。◆ framing = judgment定位=判斷
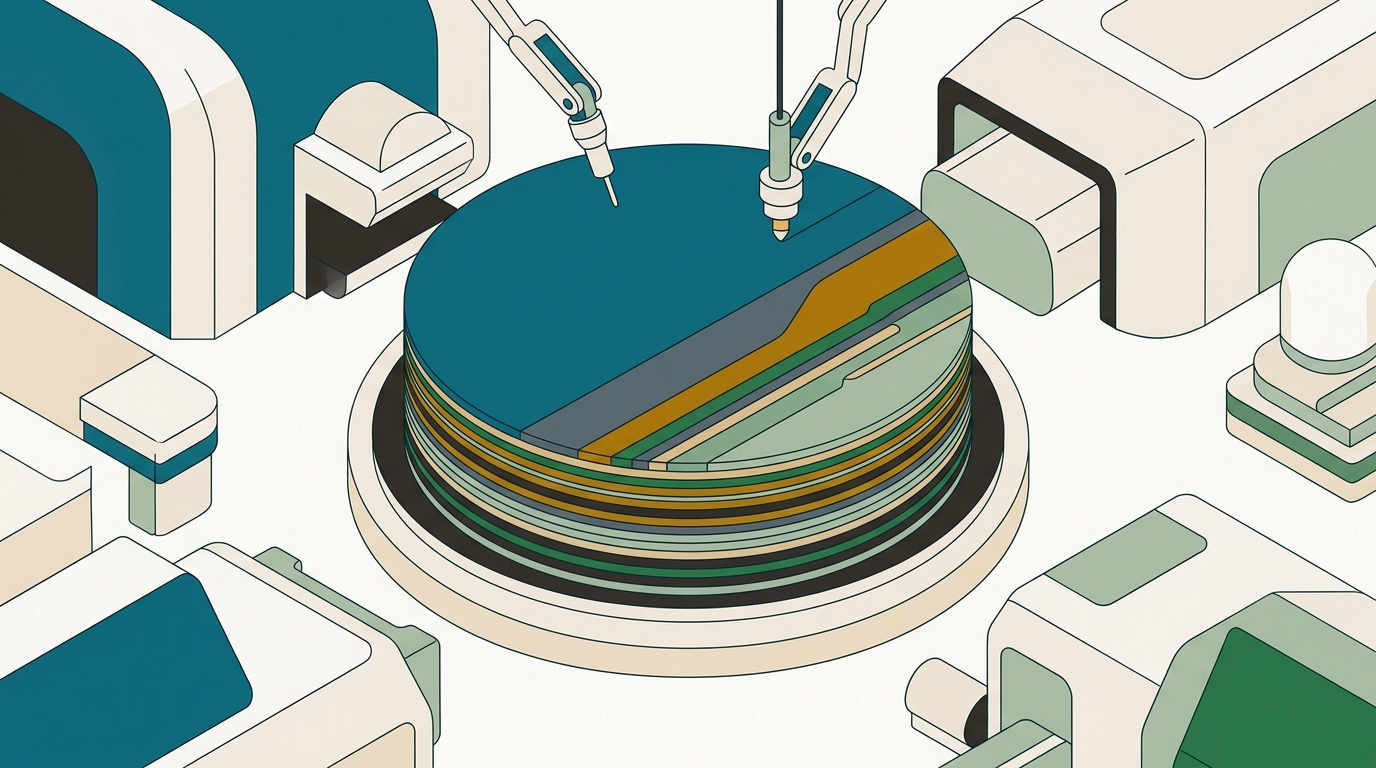
AMAT sells the steps that turn a blank silicon wafer into a chip. To judge the thesis you have to know what those steps are. Here is the wafer's journey, then a plain-language glossary.
AMAT 賣的是把一片空白矽晶圓變成晶片的那些製程步驟。要判斷這個論點,得先知道這些步驟是什麼。先看晶圓的旅程,再看白話術語表。
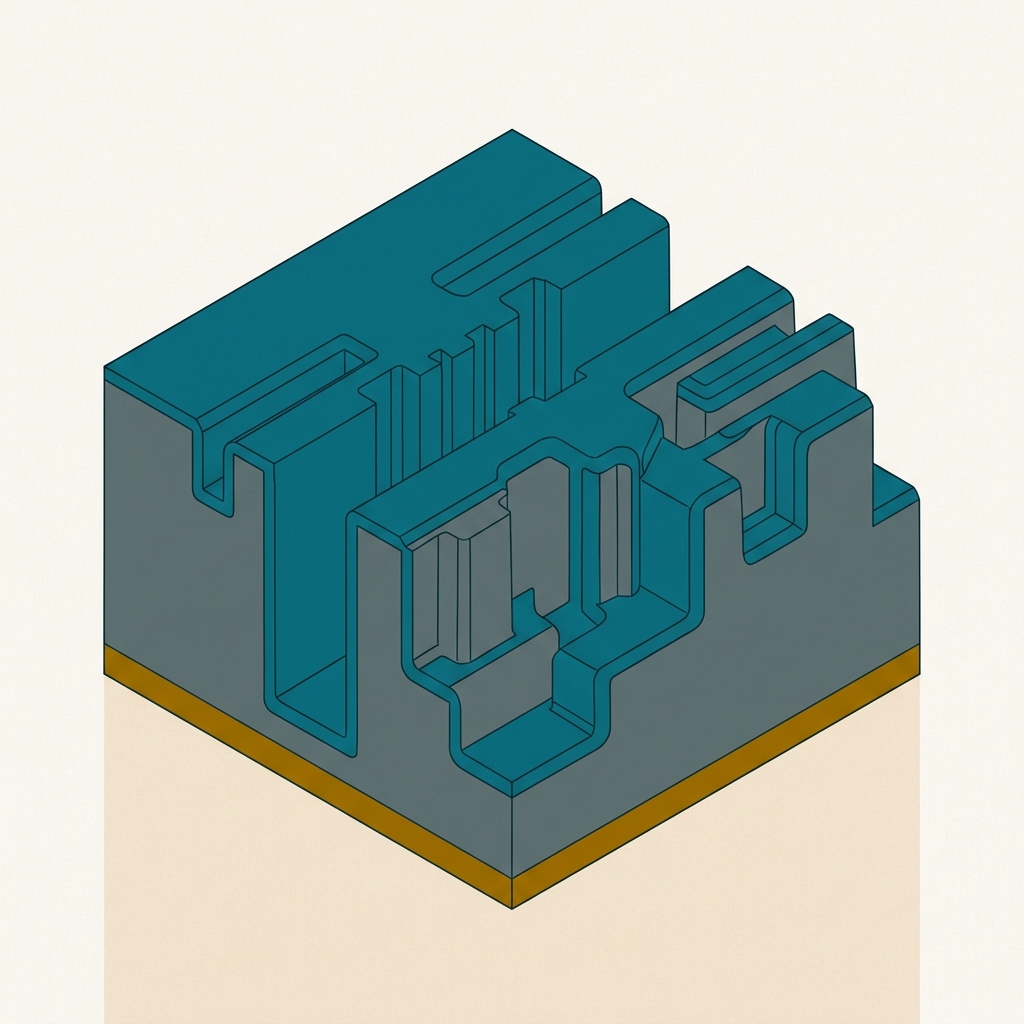
And here is what those steps physically do to the silicon — building one metal wire, in cross-section (the real copper "damascene" process):
再用剖面圖看這些步驟對矽晶到底做了什麼 — 以做出一條金屬線為例(這就是真實的銅「鑲嵌/大馬士革」製程):
Step 1 (deposit) isn't one thing — it's a ladder of tools for ever-harder 3D structures: PVD → CVD → ALD. The more vertical the chip, the more you need the precise (slower, pricier) end. This is AMAT's backyard.
第 1 步(沉積)不是單一技術,而是一排對應越來越難 3D 結構的工具:PVD → CVD → ALD。晶片越立體,越需要精準(但更慢、更貴)的那一端。這正是 AMAT 的主場。
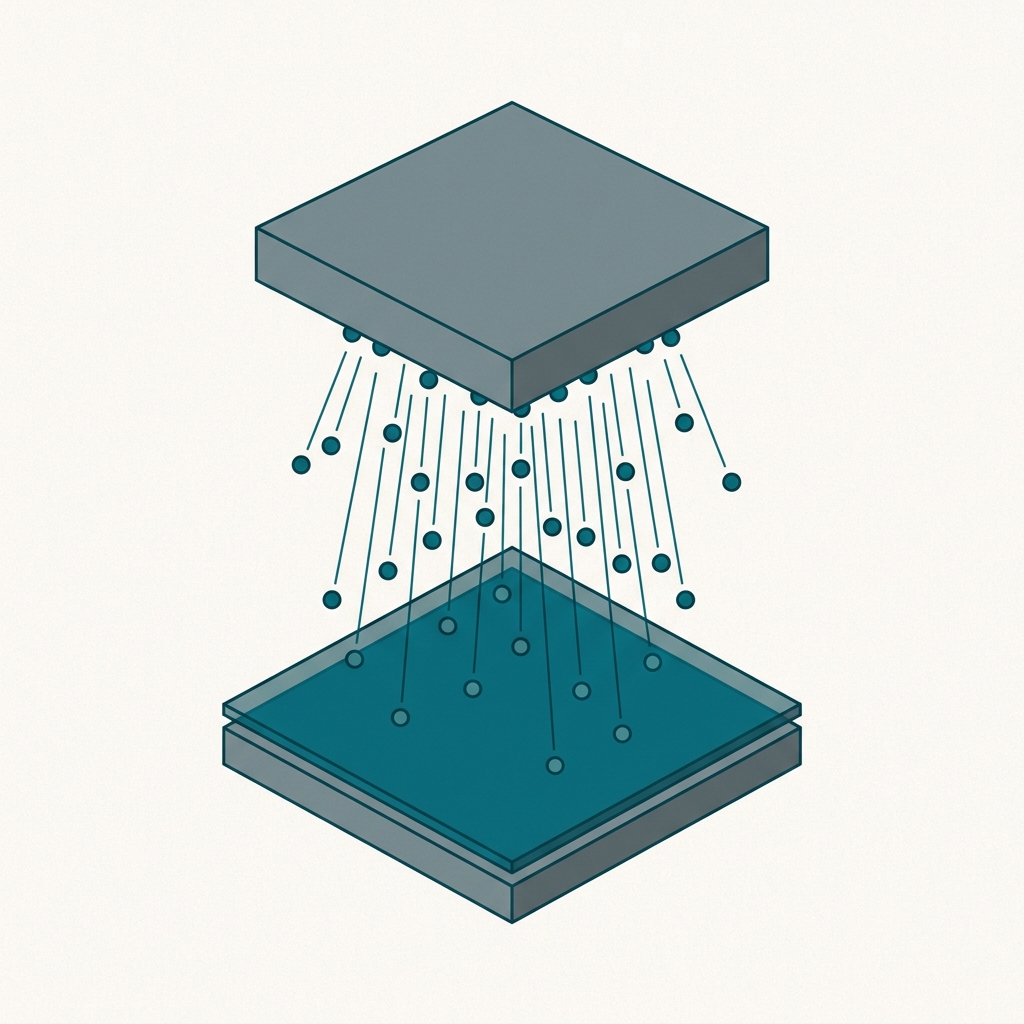
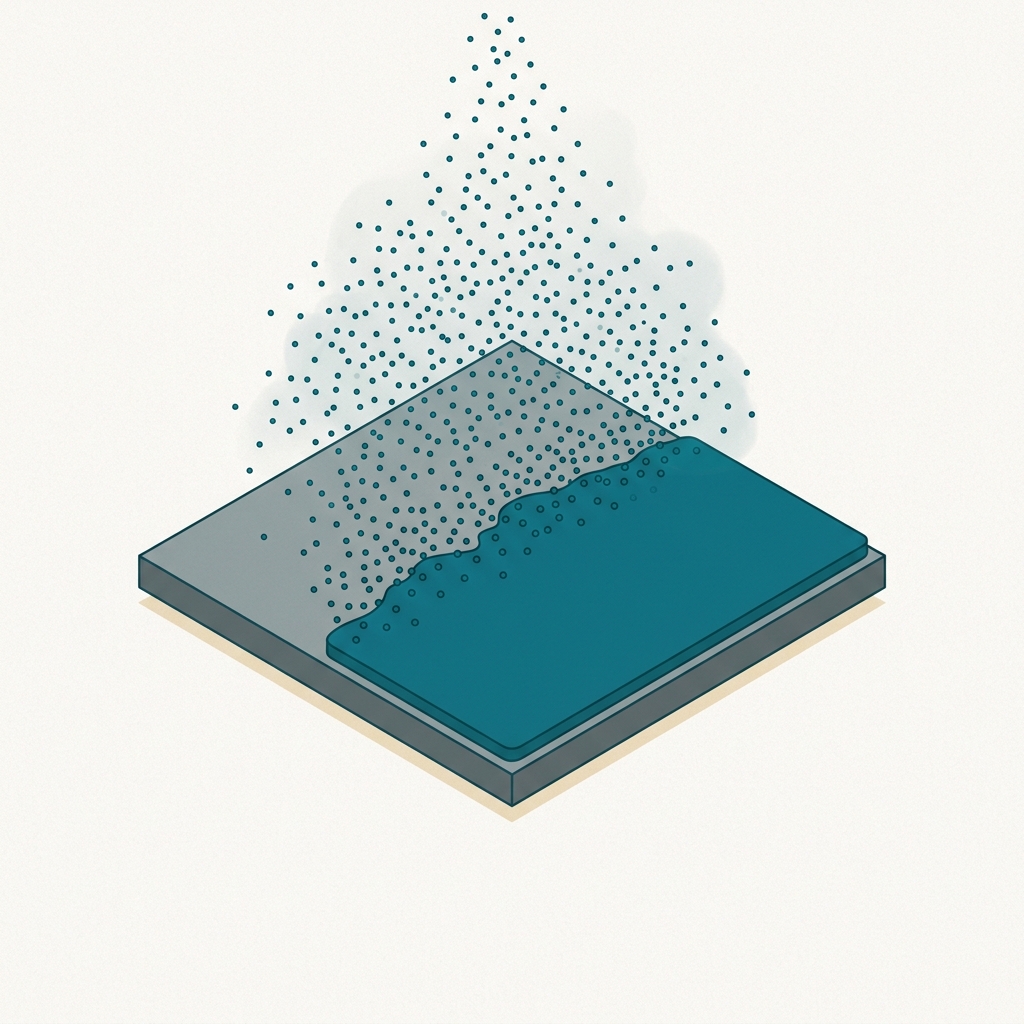
AMAT is the deposition leader — #1 in PVD and a top player in CVD and ALD. (EPI — growing a single crystal for the transistor channel — is a fourth AMAT strength.) Illustrations are conceptual.AMAT 是沉積龍頭 — PVD 市占第一,CVD 與 ALD 也是要角。(另有磊晶 EPI,長單晶當電晶體通道,也是 AMAT 強項。)圖為示意。
Whatever the method, deposition is judged on three things — and 3D chips make all three harder:
不論用哪種方法,沉積的好壞看三件事 — 而 3D 晶片讓這三件事都更難:
AMAT is the world's broadest supplier of materials-engineering equipment for making chips — the deposition, etch, CMP, implant and metrology tools from the decoder above. As chips move to GAA transistors, backside power and HBM stacking, each wafer needs more steps and higher-value tools. AMAT sells the steps.
AMAT 是全球產品線最廣的材料工程設備供應商 — 也就是上面解碼器裡的沉積、蝕刻、CMP、佈植、量測機台。當晶片走向 GAA 電晶體、晶背供電、HBM 堆疊,每片晶圓需要的步驟更多、機台單價更高。AMAT 賣的正是這些步驟。
Rising chip complexity = more materials-engineering steps per wafer. AMAT is the diversified toll-taker on that complexity, not a bet on one node or customer.
晶片複雜度上升 = 每片晶圓的材料工程步驟更多。AMAT 是這個複雜度的「多元收費員」,不是押注單一節點或客戶。
Gross margin 48.7% GAAP / 48.8% non-GAAP, +1.2pt YoY毛利率 48.7%(GAAP)/ 48.8%(非 GAAP),年增 1.2 個百分點 ✓ 10-K. corrected the draft said "low-50s" — never happened.記憶版寫「50 出頭」— 並未發生。
GAA transistors, backside power and HBM/advanced packaging each add deposition, etch, CMP and metrology steps — AMAT's strongest areas. AI capex could stay high for years.
GAA 電晶體、晶背供電、HBM/先進封裝,每一項都增加沉積、蝕刻、CMP、量測步驟 — 都是 AMAT 最強的領域。AI 資本支出可能維持高檔好幾年。
China fell from 37.2% of revenue in FY24 to 30.1% in FY25 ✓ 10-K. The bull read: mix shifts toward higher-ASP leading-edge tools for TSMC/Samsung/SK Hynix — better margins, steadier demand.
中國營收占比從 FY24 的 37.2% 降到 FY25 的 30.1% ✓ 10-K。多方解讀:產品組合轉向賣給台積電/三星/SK 海力士的高單價先進機台 — 毛利更好、需求更穩。
$6.4B of recurring, high-margin service grows with the installed base and smooths the WFE cycle — a layer the market underweights vs. lumpy systems sales.
$6.4B 的重複性高毛利服務,隨已裝機規模成長、平滑 WFE 循環 — 相對忽高忽低的機台銷售,這塊被市場低估。
Leadership in EPI for GAA and CMP for new materials; possible expansion into power semis and process-control software; CHIPS-Act onshoring as a 2026-27 tailwind. R&D $3.57B/yr funds the edge ✓ 10-K.
在 GAA 用的 EPI、新材料用的 CMP 領先;可能擴張到功率半導體與製程控制軟體;CHIPS 法案在地化是 2026–27 的順風。研發支出每年 $3.57B 支撐技術領先 ✓ 10-K。
What the market may be missing:市場可能漏看的: the duration and breadth of AI-complexity intensity.AI 複雜度需求的持續時間與廣度。 but see the headline — much of this is now in the price.但見開頭結論 — 這大半已反映在股價裡。
At ~46× forward / ~52× trailing even after July's -24% pullback (was ~55×/~76× at the 06-30 high), any growth wobble = multiple compression — the July selloff was this card executing. The stock still prices in durable, low-cyclicality growth. live · 07-22
即使經過 7 月 -24% 回檔,仍有預估 46 倍 / 歷史 52 倍(06-30 高點時為 ~55×/~76×);成長一有閃失就會本益比收縮 — 7 月的殺盤就是這張卡片的兌現。股價仍把「持久、低循環」的成長反映在價內。即時 · 07-22
If hyperscalers digest AI capacity, equipment orders can drop sharply — history says so. A "super-cycle" is itself an assumption.
若雲端大廠消化既有 AI 產能,設備訂單可能急跌 — 歷史有前例。「超級循環」本身就是一個假設。
30.1% of FY25 revenue, already down to 27% in FQ2 FY26 ✓ 10-Q · 05-14. AMAT guided a $600M FY2026 hit from expanded U.S. export curbs ✓ Reuters/TF; domestic substitution (NAURA) and Taiwan tail-risk add more.
FY25 占營收 30.1%,FQ2 FY26 已降至 27% ✓ 10-Q · 05-14。AMAT 預估美國擴大出口管制將造成 FY2026 約 $600M 衝擊 ✓ Reuters/TF;中國本土替代(NAURA 北方華創)與台海尾端風險還會再加。
Lam leads etch, KLA leads metrology, ASML owns EUV litho. AMAT must keep winning deposition/CMP while defending elsewhere.
Lam 主導蝕刻、KLA 主導量測、ASML 獨佔 EUV 微影。AMAT 得在沉積/CMP 持續贏,同時守住其他領域。
Must hold for the thesis to fail:論點要被推翻,需同時成立: sustained high AI capex from a concentrated customer set, on-time node transitions, no new export shocks, continued pricing/mix gains. Break one and the multiple unwinds.集中客戶群的 AI 資本支出持續高檔、節點轉換準時、沒有新的出口管制衝擊、定價/組合持續改善。任一條斷掉,本益比就會回吐。
CEO Gary Dickerson ✓ public — long tenure, navigated multiple cycles, positioned AMAT for advanced nodes and AI. High-quality capital allocation: heavy R&D ($3.57B), buybacks, growing dividend.
執行長 Gary Dickerson ✓ 公開 — 任期長、歷經多次循環、把 AMAT 卡位在先進節點與 AI。資本配置品質高:重研發($3.57B)、買回庫藏股、配息成長。
Insiders own just 0.3% (~$1.1B) ✓ SWS. CEO Gary Dickerson sold 78,321 shares for ~$55.5M at ~$700–736 on 2026-06-29/30 — the all-time-high days — filed 07-01; 1,599,843 shares held after ✓ SEC Form 4. President Prabu Raja sold 50,000 shares on 2026-06-04 for $25,264,197 ($503.99–507.23, via living trust) ✓ SEC Form 4. Sales at highs are common; the cluster of them AT the top, with zero buying, is a data point the bear column gets to keep.
內部人僅持股 0.3%(約 $1.1B)✓ SWS。執行長 Gary Dickerson 於 2026-06-29/30 — 正是歷史高點那兩天 — 以約 $700–736 賣出 78,321 股、約 $55.5M,07-01 申報,餘 1,599,843 股 ✓ SEC Form 4。總裁 Prabu Raja 於 2026-06-04 賣出 5 萬股、$25,264,197($503.99–507.23,透過生前信託)✓ SEC Form 4。高檔賣股常見;但成群出現在頂點、且無人買進,是空方欄位可以留著的一個數據點。
To double from $560 means a ~$890B market cap. A rising stock has two engines: (1) the company earning more, and (2) the market paying a higher P/E (re-rating). Engine 2 has now compressed twice — ~57× at the June build, ~55× at 06-30, ~46× today — while the price round-tripped through $739.67. So a double still rests on engine 1. The concrete math: at an unchanged ~46×, FY27 consensus EPS $16.75 landing in full puts the stock near $770 (+38%) — a double needs either years of compounding beyond FY27, or the re-rating this page has argued is spent. ◆
股價要從 $560 翻倍,市值要到約 $890B。一檔股票會漲靠兩個引擎:(1) 公司賺更多錢,(2) 市場願意給更高的本益比(評價重估)。引擎 2 現在已收縮兩次 — 6 月版約 57 倍、06-30 約 55 倍、現在約 46 倍 — 期間股價還走了一趟 $739.67 的來回。所以翻倍依然只能靠引擎 1。具體算給你看:本益比不變在 46 倍,FY27 共識 EPS $16.75 全數兌現,股價約到 $770(+38%) — 要翻倍,得靠 FY27 之後再複利好幾年,或是靠本頁一直主張已經用完的那個評價重估。◆
Added at the 2026-07-23 refresh — this page predates the decision-layer format. Every row is this analysis's judgment ◆, derived from the refreshed numbers above. The page keeps its original no-target-price qualitative frame; a full spine upgrade would be a rebuild.
2026-07-23 更新時新增 — 本頁早於 decision-layer 格式。每一列皆為本研究判斷 ◆,由上方更新後的數字推導。本頁維持原始的「無目標價」定性框架;完整升級屬重建範疇。
| If not holding未持有 | ◆ Don't chase the rebound. Even -24% off the high, ~46× FY26E / ~33× FY27E still prices FY27's +37% EPS landing intact — the discount is on sentiment, not on the estimate risk.不追反彈。即使距高點 -24%,~46× FY26E/~33× FY27E 仍把 FY27 EPS +37% 的完整落地計入價內 — 折價折的是情緒,不是估計風險。 |
| If holding已持有 | ◆ Hold with 08-13 (FQ3) as the tripwire: revenue below the $8.45B guide floor, or an FQ4 guide implying QoQ deceleration, → trim. Selling into a -24% hole while customer capex signals strengthen (TSMC $60-64B, Micron ~$27B) is panic, not process.續抱,以 08-13(FQ3)為絆線:營收低於指引下緣 $8.45B,或 FQ4 指引隱含 QoQ 減速 → 減碼。在客戶資本支出訊號轉強(台積電 $60-64B、美光 ~$27B)之際往 -24% 的坑裡砍單,是恐慌不是紀律。 |
| Entry zone進場區 | ◆ < ~$490 (≈40× FY26E $12.26, ≈29× FY27E $16.75) and the 08-13 print confirms the guide with no customer-capex-cut evidence. Price alone or evidence alone is half a trigger. (July's trough: $529.66 on 07-17.)< 約 $490(≈40× FY26E $12.26、≈29× FY27E $16.75)且 08-13 財報確認指引、無客戶砍資本支出證據。價格與證據缺一不可。(7 月低點:07-17 的 $529.66。) |
| Why not more aggressive為何不更激進 | ◆ Not shorting: WFE demand signals are accelerating (TSMC/Micron/SK hynix capex), FQ3 revisions run 25-up/0-down, and the CEO claims visibility "to 2030" — shorting that into a -24% hole is poor asymmetry. Not adding: FY27's $16.75 already embeds the 2027 memory-capex wave landing intact — the exact assumption the memory cycle could break.不做空:WFE 需求訊號在加速(台積電/美光/SK海力士 capex)、FQ3 修正 25 上 0 下、CEO 稱能見度「到 2030」— 對著 -24% 的坑放空,不對稱性很差。不加碼:FY27 的 $16.75 已把 2027 記憶體資本支出波完整落地當前提 — 而那正是記憶體週期最可能斷掉的假設。 |
| Invalidation失效條件 | ◆ (1) FQ3 (08-13) misses the guide floor or FQ4 guide decelerates → trim / view review. (2) Any of Samsung/SK hynix/Micron/TSMC cuts capex guidance ≥15% → FY27 consensus breaks → bear. (Upside) (3) FQ4 guide >$10B or China curbs ease → the entry zone revises up.(1) FQ3(08-13)低於指引下緣或 FQ4 指引減速 → 減碼/觀點重審。(2) 三星/SK海力士/美光/台積電任一將 capex 指引下修 ≥15% → FY27 共識破功 → 空方情境。(上行)(3) FQ4 指引 >$10B 或中國管制放寬 → 進場區上修。 |
| When時間 | Event事件 | Threshold → reaction門檻 → 反應 | Status狀態 |
|---|---|---|---|
| 2026-08-13 | FQ3 FY26 resultsFQ3 FY26 財報 | Rev ≥ $8.95B mid & FQ4 guide accelerating → base confirmed; below $8.45B floor → trim per playbook營收 ≥ 中值 $8.95B 且 FQ4 指引續增 → 基準確認;低於下緣 $8.45B → 依框架減碼 | scheduled ⚠ date via aggregators已排定 ⚠ 日期為彙整源 |
| 2026-10 | TSMC Q3 call台積電 Q3 法說 | First 2027 capex language ≥ 2026's $60-64B → FY27E supported; "digestion" language → FY27E at risk2027 capex 初步語言 ≥ 2026 的 $60-64B → FY27E 有撐;出現「消化」字眼 → FY27E 有險 | scheduled已排定 |
| 2026-12 | SEMI year-end WFE forecast; China VEU annual reviewsSEMI 年末 WFE 預測;中國 VEU 年審 | 2027 WFE revised above $135B → bull tilt; license tightening → China-hit > $600M revisit2027 WFE 上修破 $135B → 偏多;許可收緊 → 中國衝擊 >$600M 重估 | scheduled已排定 |
| ongoing持續 | Memory-maker capex guidance (Samsung/SK hynix/Micron)記憶體三雄 capex 指引 | Any cut ≥15% → invalidation row (2) fires任一下修 ≥15% → 失效條件 (2) 觸發 | monitoring監測中 |
| 2H26+ | EssilorLuxottica AR-optics | Pure information event — optionality, no threshold純資訊事件 — 選擇權價值,無門檻 | watching觀察 |
| Claim主張 | Verdict判定 | Value · source · date數值 · 來源 · 日期 |
|---|---|---|
| FY2025 revenueFY2025 營收 | ✓ | $28,368M, +4% (FY25 Q4 release 2025-11-13) |
| Semi Systems | ✓ | $20.8B / 73% (10-K) |
| AGS | ✓ | $6.4B / 23% (10-K) |
| Display | ✓ | $1.06B (10-K) |
| Gross margin毛利率 | ✗→ | 48.7% GAAP / 48.8% non-GAAP (10-K). draft "low-50s" corrected記憶版「50 出頭」已修正 |
| EPS FY25 | ✓ | GAAP $8.66 · non-GAAP $9.42 (release) |
| China mix中國占比 | ✓ | FY24 37.2% ($10.12B) → FY25 30.1% ($8.53B) (10-K) |
| 2026 China hit2026 中國衝擊 | ✓ | $600M FY2026 (Reuters / TrendForce, 2025-11) |
| Live price即時股價 | ✓ | $560.00, +118.2% YTD, -24.3% off intraday high $739.67 (IBKR 2026-07-22) |
| Trailing P/E歷史本益比 | ✗→ | ~52× TTM (incl. 1H FY26; stockanalysis 07-22 basis, cross-checked vs live含 FY26 上半年;stockanalysis 07-22 口徑,與即時價交叉核對) |
| Forward P/E預估本益比 | ✗→ | ~46× (live $560 ÷ FY26 consensus $12.26, 39 analysts, stockanalysis 07-15 — supersedes the ~$13.0 secondary figure即時 $560 ÷ FY26 共識 $12.26,39 位,stockanalysis 07-15 — 取代 ~$13.0 次級數字); ~33× on FY27E $16.75以 FY27E $16.75 計 |
| Market cap市值 | ✓ | $444.6B (live $560 × 793,959,430 sh, 10-Q cover 2026-04-26即時 $560 × 793,959,430 股,10-Q 封面 2026-04-26) |
| FQ2 FY26 (2026-05-14) | ✓ | rev $7.91B +11% YoY · GAAP EPS $3.51 · non-GAAP $2.86 · GM ~50% · China 27% (GlobeNewswire/10-Q) |
| FQ3 FY26 guide + dateFQ3 指引與日期 | ✓ | $8,950M ±$500M / non-GAAP EPS $3.36 ±$0.20; report 2026-08-13 after close (3 aggregators; IR page unconfirmed ⚠)2026-08-13 盤後公布(三家彙整源;IR 頁未直接確認 ⚠) |
| Consensus FY26/FY27共識 FY26/FY27 | ✓ | FY26 rev $33.41B / EPS $12.26 · FY27 rev $42.59B / EPS $16.75 (stockanalysis, 39 analysts, 2026-07-15); avg PT平均目標價 $623.06 (屬意見) |
| Gary Dickerson Form 4 | ✓ | 78,321 sh, 2026-06-29/30, ~$55.5M @ ~$700–736, filed 07-01 (SEC Form 4 via secform4/StockTitan) |
| Insider ownership內部人持股 | ✓ | 0.3% (~$1.1B, Simply Wall St); Vanguard 7.49% 13G 2026-03-31 |
| Prabu Raja | ✓ | 50,000 sh, 2026-06-04, $25,264,197 @ $503.99–507.23 (SEC Form 4) |
| R&D (RD&E) | ✓ | $3,570M FY25 (vs $3,233M FY24) (10-K) |
| CEO | ✓ | Gary Dickerson (public record公開資料) |
| AR-optics JDAAR 光學合作 | ✓ | EssilorLuxottica × AMAT long-term JDA, 2026-06-16 (GlobeNewswire / Euronext press release) |
| Probability split機率分布 | ◆ | 25/50/25 — model judgment, not data模型判斷,非資料 |